Will SOL fall below $110 after a 38% drop or vice versa? Here’s the Analysis!
Jakarta, Pintu News – Solana (SOL) is experiencing intense selling pressure, with its last price falling below $120, reaching its lowest point since February 2024. In the past 30 days, Solana has declined more than 38%, confirming strong bearish momentum. With strong seller dominance, SOL now faces an important test of support levels, while a potential recovery would require a break of key resistance zones to signal a change in momentum.
Ichimoku Cloud Solana Analysis
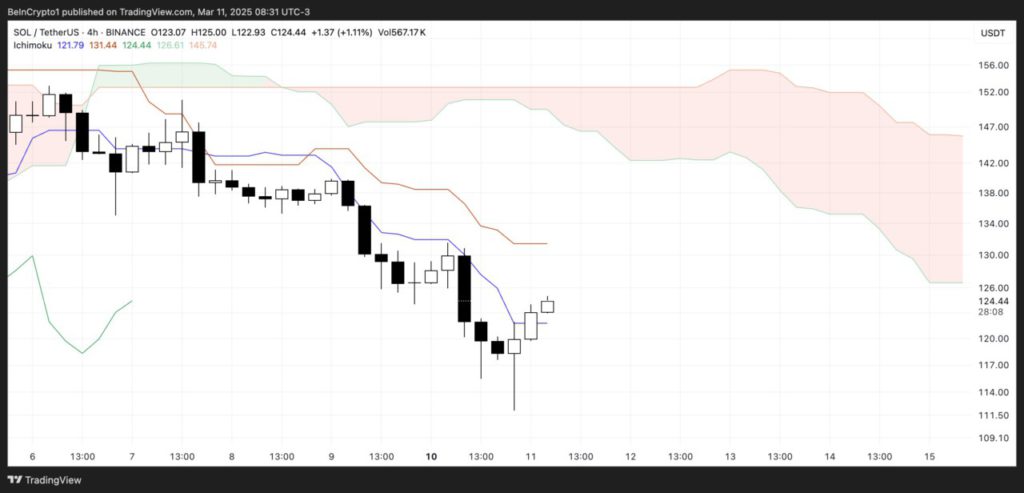
Ichimoku Cloud analysis for Solana (SOL) shows that the price is currently trading below the blue Tenkan-sen (conversion line) and red Kijun-sen (base line) lines, signaling that the short-term trend is still bearish. The price recently bounced off a local low but has not managed to reclaim this key resistance level.
In addition, the Ichimoku cloud (Kumo) which is red in color indicates a bearish sentiment in the market. The cloud is well above the current price, suggesting that despite the SOL’s short-term recovery, it will face strong resistance in the $130 to $135 range.
The position of the Tenkan-sen below the Kijun-sen further supports the bearish view, as this crossover usually signals downward momentum. To see signs of a trend reversal, SOL needs to break out of these two lines and ideally into the clouds, which would indicate a potential transition to a neutral phase.
Also Read: Bitcoin’s RSI Dominance Down? Crypto Analyst Seth Says Altcoin Market Opportunities Await!
Solana Directional Movement Index

Solana’s Directional Movement Index (DMI) chart shows that the Average Directional Index (ADX) is currently at 33.96, a sharp increase from 13.2 just two days ago. The ADX measures the strength of a trend, and readings above 25 usually indicate a strong trend, while values below 20 indicate a weak or non-existent trend. This sharp rise confirms that the ongoing downtrend on the SOL is strengthening.
The Positive Directional Index (+DI) dropped to 11.71 from 15.5 two days ago but rebounded slightly from 8.43 yesterday. In contrast, the Negative Directional Index (-DI) stood at 32.2, up from 25.9 two days ago, albeit slightly down from 35 a few hours ago. The relative positions of the +DI and -DI lines suggest that sellers are still in control, as the -DI remains much higher than the +DI.
Solana’s potential drop below $110
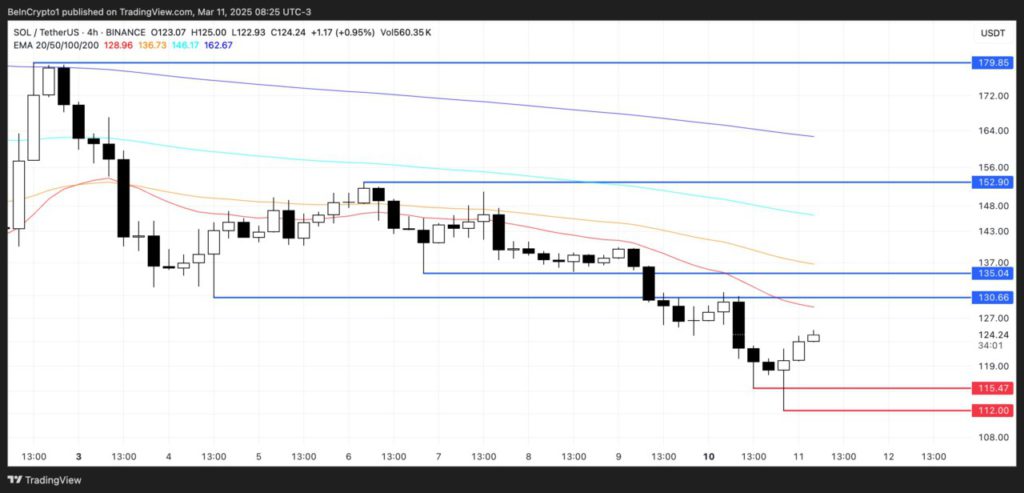
Solana’s Exponential Moving Average (EMA) line continues to show a bearish trend, with the short-term EMA being below the long-term EMA. This alignment suggests that downward momentum still dominates, although prices are currently attempting a recovery. If this rebound gains strength, Solana prices could face resistance at $130 and $135, key levels to cross for a potential trend reversal.
If it manages to break this resistance, SOL could push to $152.9, a significant level which, if passed with strong buying pressure, might pave the way for a rally towards $179.85 – a price level last seen on March 2, when SOL was added to the US crypto strategic reserve.
However, if the bearish structure remains intact and selling pressure persists, Solana could retest the $115 and $112 support levels, both of which have previously acted as key price floors. Failure to hold this support could open the door for a deeper drop, possibly pushing SOL below $110 for the first time since February 2024.
Conclusion
With various technical indicators showing the continued strength of the bearish trend, Solana’s chances of maintaining its current price levels appear slim. Investors and traders should pay attention to these indicators to anticipate further price movements, taking into account that crypto markets are often unpredictable and influenced by various external factors.
Also Read: Will ETH Fall Below $1,500 Before the Market Recovers? Here’s the Price Pattern Analysis! (3/13/25)
That’s the latest information about crypto news today. Get more information about crypto academy from beginner to expert level only at Pintu Academy and enrich your knowledge about the world of crypto and blockchain.
Follow us on Google News to get the latest information about crypto and blockchain technology. Enjoy an easy and secure crypto trading experience by downloading Pintu Crypto via Google Play Store or App Store now.
Experience web trading with advanced trading tools such as pro charting, various order types, and portfolio tracker only at Pintu Pro. Click Register Pintu if you don’t have an account or click Login Pintu if you are already registered.
*Disclaimer
This content aims to enrich readers’ information. Pintu collects this information from various relevant sources and is not influenced by outside parties. Note that an asset’s past performance does not determine its projected future performance. Trading crypto carries high risk and volatility, always do your own research and use cold hard cash before investing. All activities of buying andselling Bitcoin and other crypto asset investments are the responsibility of the reader.
Reference
- BeInCrypto. Solana Price at Risk of Further Decline. Accessed on March 13, 2025
- Featured Image: Crypto Rank
Latest News
© 2025 PT Pintu Kemana Saja. All Rights Reserved.
The trading of crypto assets is carried out by PT Pintu Kemana Saja, a licensed and regulated Digital Financial Asset Trader supervised by the Financial Services Authority (OJK), and a member of PT Central Finansial X (CFX) and PT Kliring Komoditi Indonesia (KKI). The trading of crypto asset futures contracts is carried out by PT Porto Komoditi Berjangka, a licensed and regulated Futures Broker supervised by BAPPEBTI, and a member of CFX and KKI. Crypto asset trading is a high-risk activity. PT Pintu Kemana Saja and PT Porto Komoditi Berjangka do not provide any investment and/or crypto asset product recommendations. Users are responsible for thoroughly understanding all aspects related to crypto asset trading (including associated risks) and the use of the application. All decisions related to crypto asset and/or crypto asset futures contract trading are made independently by the user.
