Is Solana About to Explode Past $200? These 3 Charts Say It Might!
Jakarta, Pintu News – The price of Solana (SOL) has recorded an impressive surge of 21% in the last seven days. However, the recent release of FTX assets raises uncertainty over whether the altcoin is capable of breaking the $200 level.
Amidst the uncertainty, three chart patterns based on different metrics emerged, indicating that the SOL is likely to surpass this psychological level in the near future and potentially even chase record highs.
Solana Price Today as Rise Stalled at $179 Level
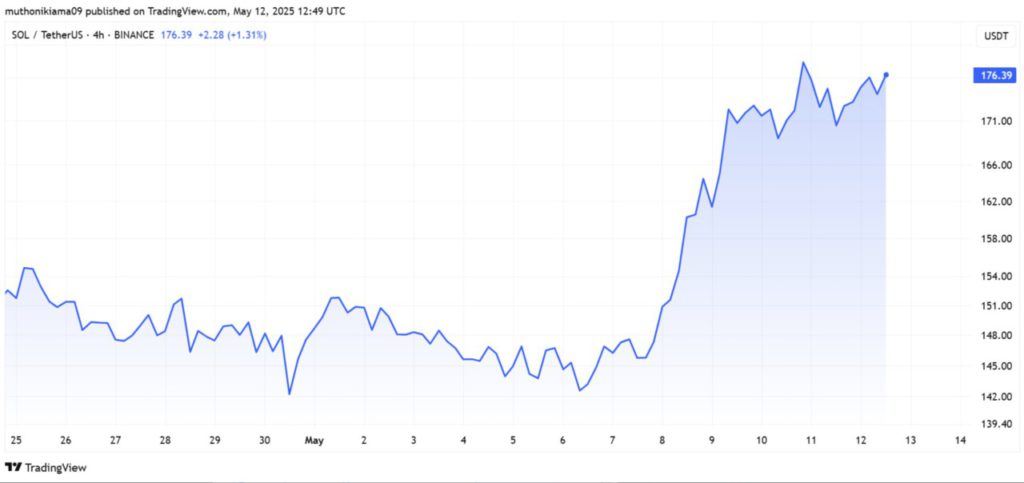
The Solana (SOL) price as of May 12, 2025 was trading at $175 after recording a slight increase of 0.5% in the last 24 hours.
During this period, SOL reached a daily high of $179 which was also an important resistance point, before returning to a limited range pattern.
Read also: Will Ripple (XRP) Explode Past $3 This Week? Bullish Chart Pattern and Whale Moves Say Yes!
Solana was rejected at $179 after reports surfaced that FTX had unlocked 187,600 SOL tokens worth $32.79 million from its staking account. The release of these tokens raised concerns of a potential sell-off that could affect the SOL price.
However, Solana’s price increase is expected to continue, along with the positive sentiment in the crypto market today – as Bitcoin (BTC) briefly broke the $105,000 level.
In addition, three technical analysis charts show that SOL is likely to continue its uptrend, break the $179 resistance, and potentially surpass the $200 mark.
Potential Breakout of the Rising Channel
One of the charts that explains why Solana’s price has a chance to break through the $179 resistance level and reach $200 is the daily chart that shows a potential breakout from an ascending parallel channel pattern.
Currently, SOL is testing the upward sloping resistance line, and if it manages to break this level, the price is expected to surge up to $219.
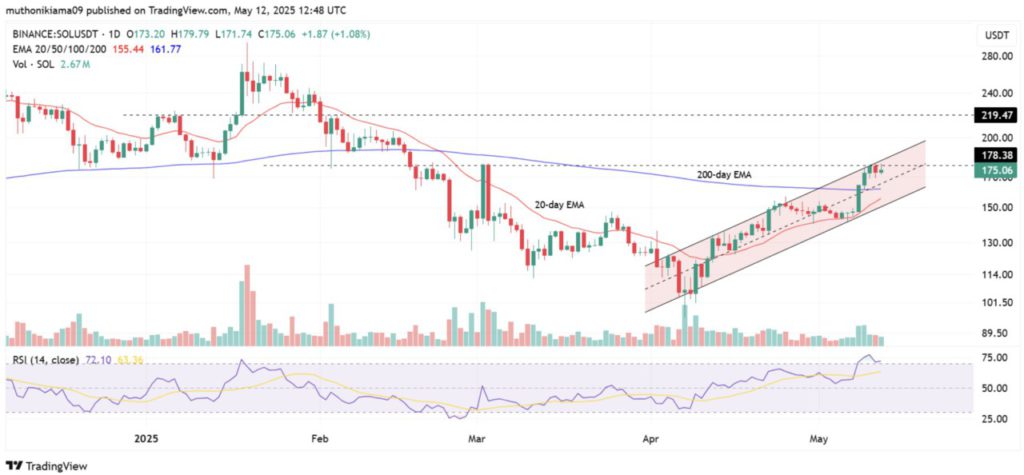
The technical indicators on the daily chart also support the possibility of Solana’s breakout above $180 and a rally towards $200. The RSI indicator has risen and touched 72, signaling strong bullish momentum and room for further growth as the price has not yet entered the overbought zone.
Additionally, the 20-day SMA line is pointing upwards and is heading for a potential crossover with the 200-day Exponential Moving Average (200-day EMA).
If this crossover occurs, it will further strengthen the chances of Solana’s price rising past $200.
SOL Weekly Active Address Touches the Highest Level in 3 Months
Artemis’ daily active address chart also reinforces why Solana’s price has the potential to reach $200 in the near future, despite the release of $32 million worth of tokens by FTX and bankrupt Alameda.
Read also: 3 Crypto to Watch This Week: Ethereum, Pi Network, and Solayer!
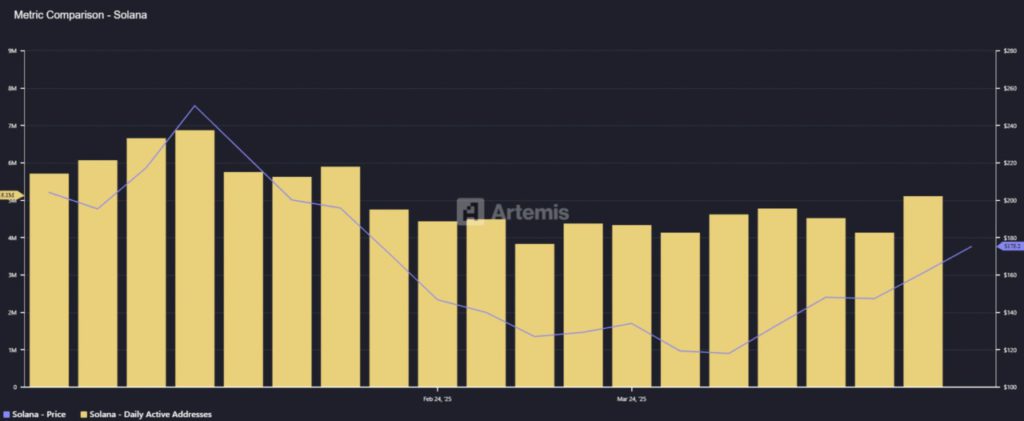
This metric recently surged past the 5.1 million mark, becoming the highest since mid-February.
An increase in the number of weekly active addresses indicates a spike in user demand and network activity, which is often an early indicator of significant price movement in a token.
This high number of addresses also reflects increased user engagement and greater liquidity-important factors that can drive upward price trends.
Solana Prices in Line with Global Liquidity
The global liquidity index chart further reinforces the reason why Solana prices have the potential to break $200 and even reach new record highs.
Analysts at curb.sol note that SOL’s price movement follows the global liquidity trend, which suggests that the token not only has a chance to cross $200, but could also target the $400 level.
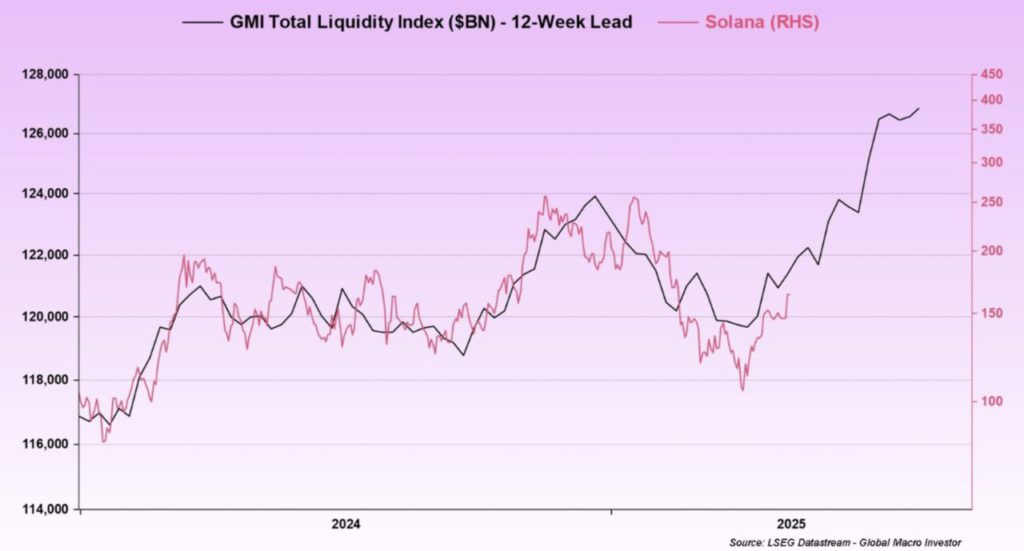
Looking at previous trends, SOL tends to rise as global liquidity – a metric used to measure the amount of money circulating in the market – increases. This supports Solana’s bullish price projections and strengthens the possibility that SOL will soon surpass the $200 level.
Thus, based on three key charts-the daily price chart showing the potential breakout, the increase in weekly active addresses, and the surge in global liquidity-it is clear that Solana has strong potential to break through the $179 resistance and reach $200.
If this psychological level is successfully passed, SOL has the potential to continue its rally towards all-time highs.
That’s the latest information about crypto. Follow us on Google News to stay up-to-date on the world of crypto and blockchain technology.
Enjoy an easy and secure crypto trading experience by downloading Pintu crypto app via Google Play Store or App Store now. Also, experience web trading with advanced trading tools such as pro charting, various types of order types, and portfolio tracker only at Pintu Pro. Pintu Pro Futures is also available, where you can buy bitcoin leverage, trade btc futures, eth futures and sol futures easily from your desktop!
*Disclaimer
This content aims to enrich readers’ information. Pintu collects this information from various relevant sources and is not influenced by outside parties. Note that an asset’s past performance does not determine its projected future performance. Crypto trading activities have high risk and volatility, always do your own research and use cold cash before investing. All activities of buying and selling bitcoin and other crypto asset investments are the responsibility of the reader.
Reference:
- Coingape. 3 Charts Explain Why Solana Price Could Reach $200 Despite $32M FTX Unlocks. Accessed on May 13, 2025
Latest News
© 2026 PT Pintu Kemana Saja. All Rights Reserved.
The trading of crypto assets is carried out by PT Pintu Kemana Saja, a licensed and regulated Digital Financial Asset Trader supervised by the Financial Services Authority (OJK), and a member of PT Central Finansial X (CFX) and PT Kliring Komoditi Indonesia (KKI). Crypto asset trading is a high-risk activity. PT Pintu Kemana Saja do not provide any investment and/or crypto asset product recommendations. Users are responsible for thoroughly understanding all aspects related to crypto asset trading (including associated risks) and the use of the application. All decisions related to crypto asset and/or crypto asset futures contract trading are made independently by the user.