Bitcoin Plunges to $108K — Is This the Start of a Major Crash? Bearish Pattern Signals Trouble Ahead
Jakarta, Pintu News – Bitcoin (BTC) has risen by 3.38% in the past 12 hours, trying to bounce back from the sharp correction that occurred on Friday.
However, technical and on-chain data suggests that the price of BTC is unlikely to touch its record high of $111,959 again, or even break higher towards $120,000.
Then, how is the current Bitcoin price movement?
Bitcoin Price Drops 0.38% in 24 Hours
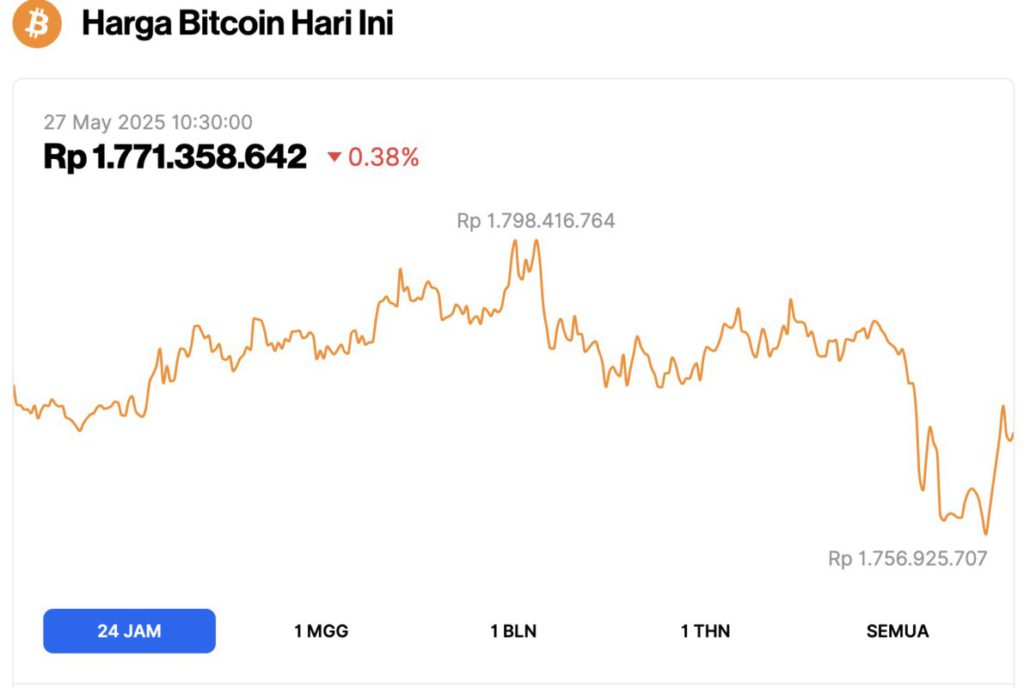
On May 27, 2025, Bitcoin was trading at $108,955, equivalent to IDR 1,771,358,642, marking a modest 0.38% dip over the past 24 hours. Within this timeframe, BTC reached a daily high of IDR 1,798,416,764 and a low of IDR 1,756,925,707.
According to CoinMarketCap, Bitcoin’s market capitalization now stands at around $2.16 trillion, with trading volume in the last 24 hours rising 6% to $49.61 billion.
Read also: 3 Crypto that Could Hit a New All-Time High in June 2025
Why BTC’s $120,000 Price Rise is Unlikely to Happen in the Near Future?
In the long term, the chances of Bitcoin (BTC) setting a new record high (ATH) above $120,000 are quite high as the outlook on the broader timeframe is still bullish.
However, on a shorter timeframe, the price of BTC is still showing a bearish trend due to the following three important signals:
- Technical analysis indicates a possible reversal or short-term correction.
- Whale investors holding between 100,000 and 1 million BTC have started to reduce their holdings.
- Data from the blockchain shows that there was clear profit-taking activity.
These three factors hint that in the near future, BTC prices are likely to experience a temporary pause or decline.
Bitcoin Weekly Chart Shows a Bearish Swing Failure Pattern
The weekly candlestick closure shows that Bitcoin (BTC) price briefly broke the previous record high of $110,000, but failed to close above that level.
This technical formation is known as a swing failure pattern, which is when the asset fails to show the strength to hold above a key level after breaking through it.
In addition, the RSI (Relative Strength Index) indicator is showing a lower high, while the Bitcoin price is printing a higher high. This reflects a classic bearish divergence pattern, where the divergence in direction between the price and momentum indicators signals weak buying strength – which is usually a sign of a price correction.
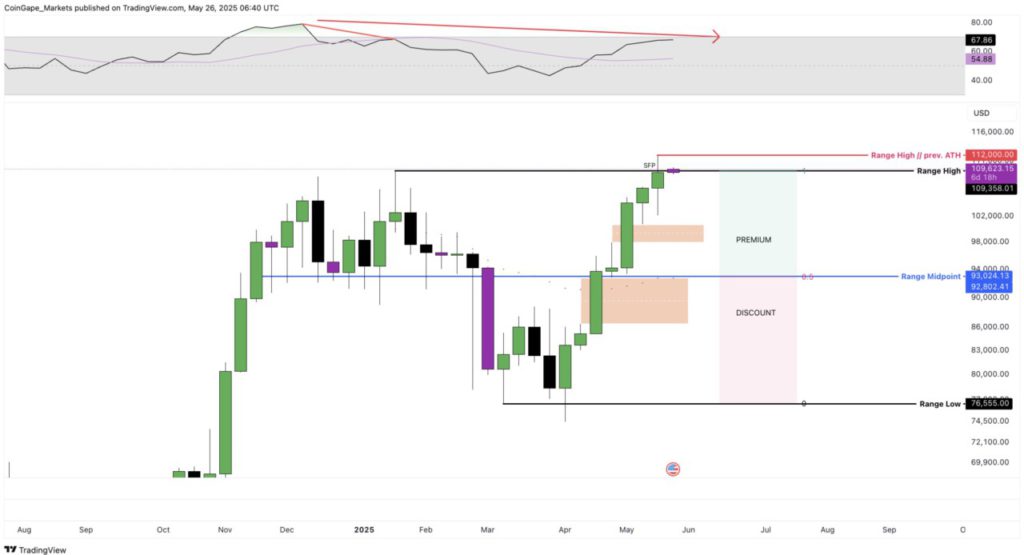
In this context, the 43% price spike from $76,555 to $110,000 is an important swing on the larger timeframe and needs to be watched by investors.
If the surge is deemed too high or “overextended” as signaled by the indicator, then a price correction is likely to occur. Generally, when an uptrend becomes saturated, the price will correct towards fair value or even into the discount zone.
In this case, the midpoint of the 43% rally is around $93,024, which is considered the fair value.
Read also: 3 Potential Airdrops in June 2025!
If the price falls below this level, it is considered to be entering the discount zone, which is often an accumulation area for large investors or smart money such as whales.
Whale begins to offload BTC holdings
Blockchain data from Santiment shows that whales – large investors holding between 100,000 to 1 million BTC – started selling their holdings.
Previously, the amount of BTC they owned increased from 647.73 thousand to 679.63 thousand BTC in the period from February to April 2025. At that time, they accumulated when the price of Bitcoin was in a consolidation phase in the range of $75,000 to $88,000.
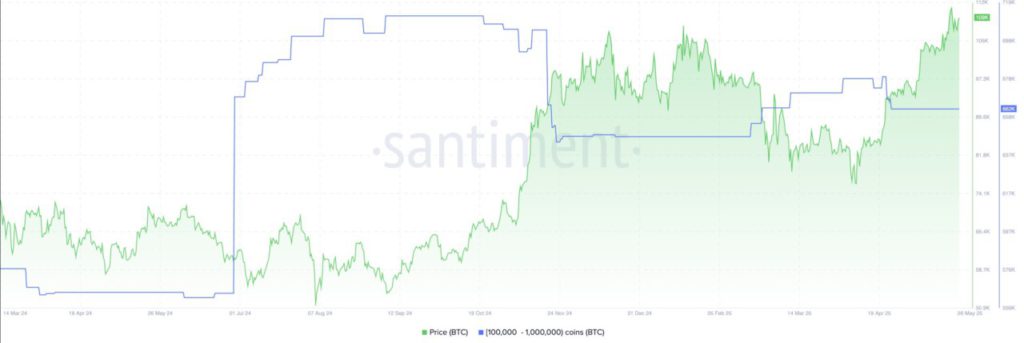
Now, the whales are starting to unwind their holdings, which creates additional pressure on the Bitcoin price. This pressure is compounded by the fact that the price is now also below a key resistance level, further minimizing the chances of an uptick in the near future.
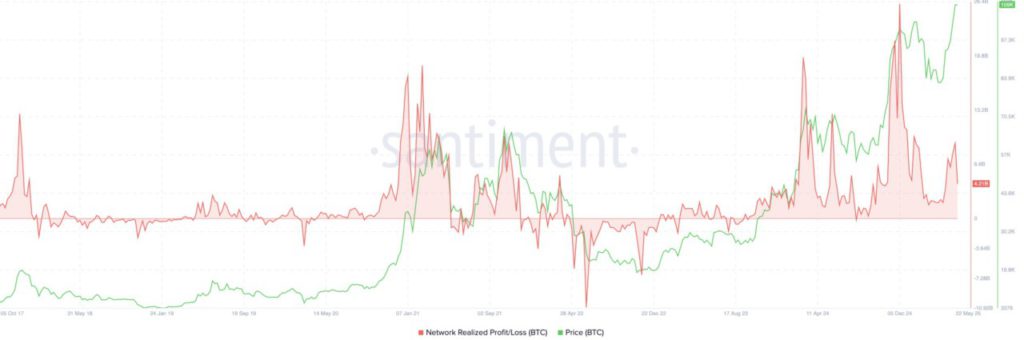
Profit Taking Increases as BTC Consolidates Below Previous ATH
In general, when Bitcoin price approaches or tries to break the previous record high (ATH), profit-taking activity tends to increase.
Investors who bought during the previous high, or before the latest spike, are starting to realize profits. This has led to BTC prices continuing to move sideways (consolidate) around previous highs.
The Network Realized Profit/Loss (NPL) indicator recorded a sharp jump from $2.3 billion to $9.18 billion as BTC prices rose from $82,000 to $111,000.
Read also: 4 Crypto Projects Ready to Unlock Tokens in Early June 2025!
Historically, large spikes in NPLs often mark local peaks, as many investors start selling to lock in profits.
In conclusion, the weekly chart shows a signal of weakness reinforced by whale behavior and a spike in the NPL indicator. With more investors taking profit, the possibility of a price correction towards key support levels is very high.
Unless significant new capital flows occur, the likelihood of BTC prices rising to $120,000 or more in the near future is slim.
That’s the latest information about crypto. Follow us on Google News to stay up-to-date on the world of crypto and blockchain technology.
Enjoy an easy and secure crypto trading experience by downloading Pintu crypto app via Google Play Store or App Store now. Get a web trading experience with advanced trading tools such as pro charting, various types of order types, and portfolio tracker only at Pintu Pro. Pintu Pro Futures is also available, where you can buy bitcoin leverage, trade btc futures, eth futures and sol futures easily from your desktop!
*Disclaimer
This content aims to enrich readers’ information. Pintu collects this information from various relevant sources and is not influenced by outside parties. Note that an asset’s past performance does not determine its projected future performance. Crypto trading activities have high risk and volatility, always do your own research and use cold cash before investing. All activities of buying and selling bitcoin and other crypto asset investments are the responsibility of the reader.
Reference:
- Coingape. 3 Reasons BTC Price Is Not Rallying to $120,000 or Higher. Accessed on May 27, 2025
Latest News
© 2026 PT Pintu Kemana Saja. All Rights Reserved.
The trading of crypto assets is carried out by PT Pintu Kemana Saja, a licensed and regulated Digital Financial Asset Trader supervised by the Financial Services Authority (OJK), and a member of PT Central Finansial X (CFX) and PT Kliring Komoditi Indonesia (KKI). Crypto asset trading is a high-risk activity. PT Pintu Kemana Saja do not provide any investment and/or crypto asset product recommendations. Users are responsible for thoroughly understanding all aspects related to crypto asset trading (including associated risks) and the use of the application. All decisions related to crypto asset and/or crypto asset futures contract trading are made independently by the user.