Bitcoin Holds Strong at $105K — But Is a Drop Below $103K Coming Soon?
Jakarta, Pintu News – Recent global developments have affected the price of Bitcoin (BTC), which has been seen fluctuating in recent days.
Earlier this week, Bitcoin had shown a positive trend, recovering after a $239 million flow into BlackRock’s Bitcoin ETF caught the market’s attention. This recovery was also in line with the influx of new funds into the ETF as well as increased accumulation from large financial institutions.
This increase comes as Bitcoin price is trading above $105,000, after a week of volatility, liquidation activity, and price consolidation.
With IBIT leading the ETF inflows and having accumulated over 666,000 BTC, these developments reflect the growing involvement of institutions amidst changing market momentum and increasing trading volumes.
Then, how is the current Bitcoin price movement?
Bitcoin Price Up 0.39% in 24 Hours
Read also: 3 Altcoins that Soared This Week: How Far Will These Tokens Fly?
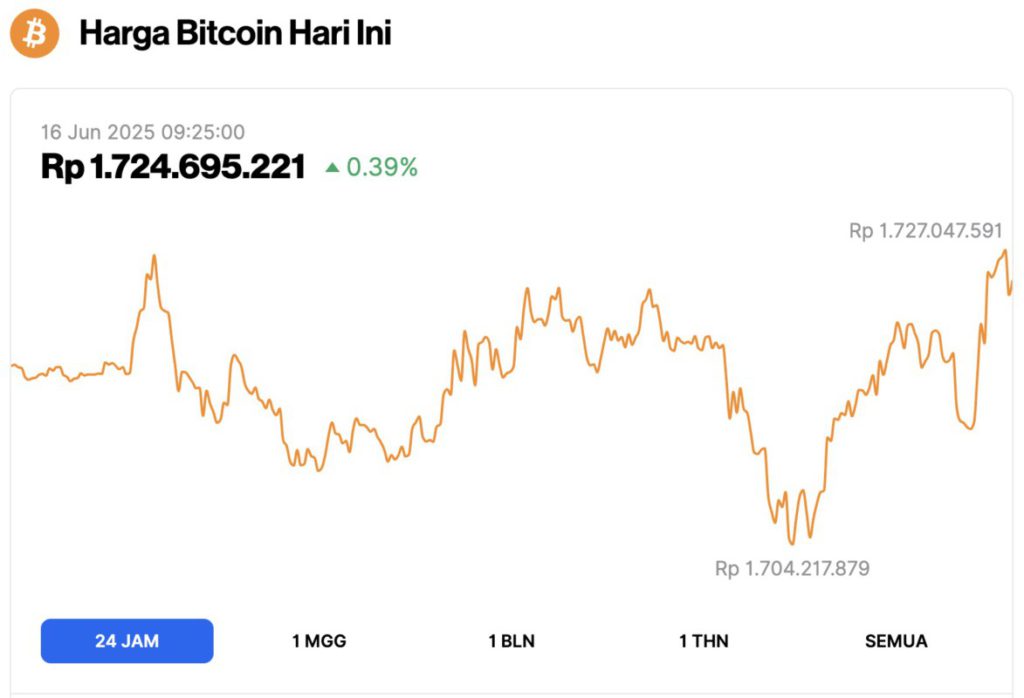
As of June 16, 2025, Bitcoin was trading at $105,802, or approximately IDR 1,724,695,221, marking a modest 0.39% gain over the past 24 hours. Throughout the day, BTC fluctuated between a low of IDR 1,704,217,879 and a high of IDR 1,727,047,591.
According to CoinMarketCap, Bitcoin’s market capitalization now stands at around $2.1 trillion, with trading volume in the last 24 hours rising 5% to $37.41 billion.
BlackRock’s $239 Million Bitcoin Purchase Signals Institutional Activity
On June 13, 2025, BlackRock reportedly purchased $239 million worth of Bitcoin. This purchase pushed the company’s total exposure to Bitcoin to a new high.
Following the announcement, Bitcoin’s price surged to $105,062, while BTC/USD trading volume increased by more than 34% within 24 hours, indicating a strong market reaction.
The acquisition comes on the heels of a surge in activity in Bitcoin ETFs. BlackRock’s iShares Bitcoin Trust (IBIT) recorded a 5.7% increase in trading volume, surpassing 1.2 million shares traded.
According to data from Santiment, total weekly net fund flows to spot Bitcoin ETFs in the US reached $970 million, with IBIT accounting for more than $900 million. On Thursday alone, IBIT added 2,681 BTC and recorded a daily trading volume of $2.2 billion.
IBIT’s assets under management (AUM) increased from $70 billion to $73 billion, despite market volatility. Currently, IBIT holds 666,842 BTC.
Besides IBIT, other ETFs such as Fidelity’s FBTC and Bitwise’s BITB also saw fund inflows of $25.2 million and $14.9 million respectively on Friday.
Bitcoin ETF Data & Accumulation Show Continued Market Interest
According to The Coin Republic (15/6), from April to June 2025, inflows into Bitcoin ETFs returned at a moderate rate, averaging between $200 million and $500 million per day.
Despite occasional outflows, the dominance of inflows (indicated by the green chart) continues to provide stability to the Bitcoin price, which remains in the $100,000 to $105,000 range.
Read also: 3 Crypto Scooped by Whales This Week, Potential to Soar?
This differs from the period from January to March 2025, when outflows approaching $1 billion on some days led to price volatility and failure to set new record highs. The situation was likely triggered by investors’ concerns over risk and regulation.
On-chain accumulation data supports the current market structure. According to CryptoQuant, more than $3.3 billion in BTC has flowed into wallets categorized as accumulation wallets, with total holdings reaching 2.91 million BTC.
These wallets are generally associated with institutions or large holders, with an average purchase price of around $64,000 per BTC.
Consistent accumulation and steady ETF fund flows indicate that institutional players are building long-term exposure, although overall market momentum remains neutral with no signs of a breakout in the near term.
Bitcoin Price: Liquidation and Market Volatility Increase Around Support Zone
The chart from CoinGlass shows alternating waves of liquidation. In early May, there was an equal amount of long and short liquidation, reflecting the market moving in a range-bound manner.
However, from May 23 to June 1, the dominance of green bars increased-signaling the liquidation of long positions, as the bulls used excessive leverage when the price experienced a small decline.
The big peak occurred on June 6, with the liquidation of short positions reaching almost $300 million, triggering a short squeeze. However, just a few days later, on June 10, the market reversed course again with $200 million worth of long liquidations – showing how quickly sentiment can change.
On June 12-13, another liquidation of short positions took place, with total losses reaching $250 million, amid continued market volatility.
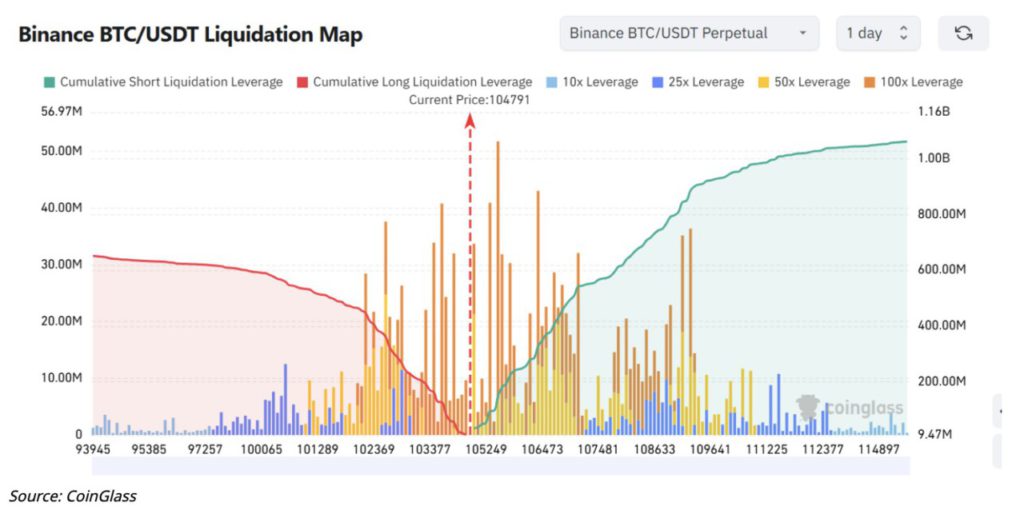
The red and green zones on the chart indicate the liquidation cluster. Below the price of $103.377, highly leveraged long positions (50x-100x) face a liquidation risk of between $20 million and $50 million per price level.
Meanwhile, above $105,250, the exposure of short positions exceeds $1 billion – indicating a very high potential short squeeze. This pattern reflects a highly leveraged market that “punishes” both bulls and bears, with large liquidations that can happen very quickly in either direction.
Bitcoin price holds major support amid market correction
Based on data, the price of Bitcoin on June 15 was trading at around $105,000 on the daily chart, a slight decline from the previous high of around $108,000.
Read also: 11 Memecoins Worth Hunting for June 2025
Multiple red candles with long upper wicks indicate price rejection at higher levels, indicating selling pressure as prices approach the resistance area.
However, Bitcoin price is still above the $102,000-$104,000 zone, which was previously a consolidation area. Technical indicators are currently showing an increase in negative momentum.
The MACD indicator indicates a bearish crossover, where the MACD line is below the signal line, and the histogram is at a negative level of -283. This indicates that the short-term momentum is starting to weaken.
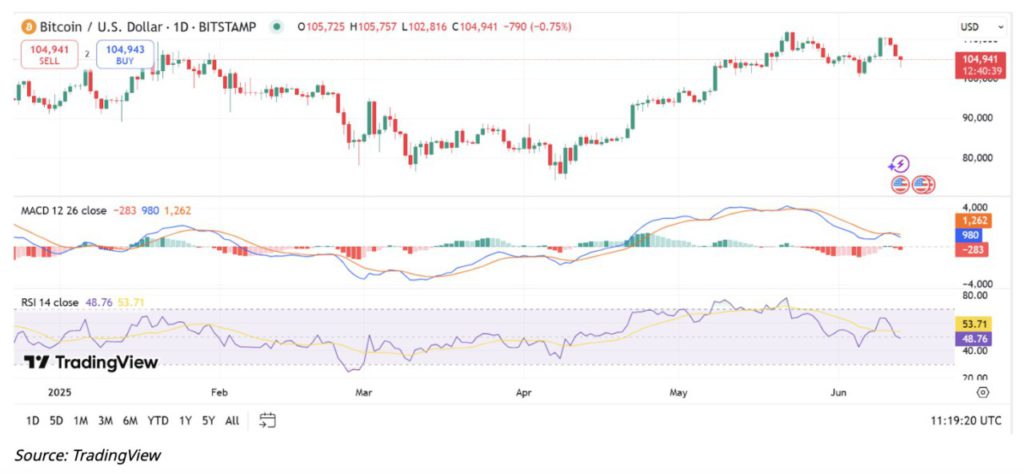
The RSI (Relative Strength Index) is around the 50 mark, having broken the downward moving average at 53.71, indicating a mild bearish trend. The RSI has not yet entered the oversold zone, so it still has room to fall further.
Market sentiment is still affected by global macroeconomic uncertainties and geopolitical tensions. Chart formations are currently trending neutral to bearish, with no clear signs of trend reversal.
The price is still moving within a certain range, but the momentum indicator is signaling caution as the strength of the previous bullish trend is starting to weaken.
That’s the latest information about crypto. Follow us on Google News to stay up-to-date on the world of crypto and blockchain technology.
Enjoy an easy and secure crypto trading experience by downloading Pintu crypto app via Google Play Store or App Store now. Also, experience web trading with advanced trading tools such as pro charting, various types of order types, and portfolio tracker only at Pintu Pro. Pintu Pro Futures is also available, where you can buy bitcoin leverage, trade btc futures, eth futures and sol futures easily from your desktop!
*Disclaimer
This content aims to enrich readers’ information. Pintu collects this information from various relevant sources and is not influenced by outside parties. Note that an asset’s past performance does not determine its projected future performance. Trading crypto carries high risk and volatility, always do your own research and use cold hard cash before investing. All activities of buying and selling bitcoin and other crypto asset investments are the responsibility of the reader.
Reference:
- The Coin Republic. Will Bitcoin Price Hold Above $105K or Crash Below $103K? Accessed on June 16, 2025
Latest News
© 2026 PT Pintu Kemana Saja. All Rights Reserved.
The trading of crypto assets is carried out by PT Pintu Kemana Saja, a licensed and regulated Digital Financial Asset Trader supervised by the Financial Services Authority (OJK), and a member of PT Central Finansial X (CFX) and PT Kliring Komoditi Indonesia (KKI). Crypto asset trading is a high-risk activity. PT Pintu Kemana Saja do not provide any investment and/or crypto asset product recommendations. Users are responsible for thoroughly understanding all aspects related to crypto asset trading (including associated risks) and the use of the application. All decisions related to crypto asset and/or crypto asset futures contract trading are made independently by the user.