Bitcoin Skyrockets to $104,000 — Is a New All-Time High Just Around the Corner?
Jakarta, Pintu News – Bitcoin (BTC) price is struggling to hold on to the $100,000 level after experiencing a sharp drop over the weekend that touched $98,225. Despite this, the BTC price managed to recover by 2.82% and closed above the psychological level.
As of Monday, June 23, BTC prices had risen nearly 1% and were trading around $101,500. With the New York trading session having started, traders are now eyeing the support level at $99,800 and resistance at $102,600 as a reference for the next big move.
In this BTC price analysis, let’s discuss the crucial levels and whether BTC is gearing up for a rally towards an all-time high (ATH) or a deeper drop.
Bitcoin Price Up 3.42% in 24 Hours
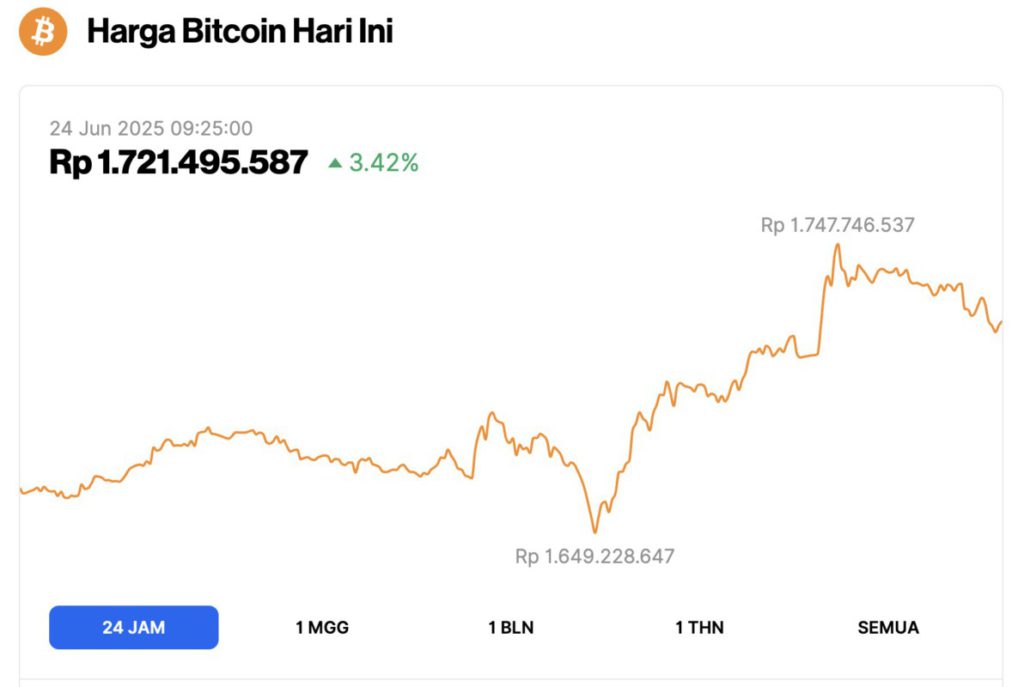
On June 24, 2025, Bitcoin’s price surged to $104,995 — approximately IDR 1,721,495,587 — marking a 3.42% gain over the past 24 hours. Throughout the day, BTC fluctuated between a low of IDR 1,649,228,647 and a high of IDR 1,747,746,537.
According to CoinMarketCap, Bitcoin’s market capitalization now stands at around $2.08 trillion, with trading volume in the last 24 hours rising 3% to $65.09 billion.
Read also: BTC Dominance Soars to New Highs as Middle East Tensions Explode — Altcoins Crumble Under Pressure!
Bitcoin Price Analysis: Here’s What Investors Can Expect This Week
The Time Price Opportunity(TPO) chart for Bitcoin (BTC) shows an important short-term outlook for investors to forecast the direction of price movements in today’s New York trading session.
The TPO chart reveals that the Value Area Low at $99,800 recorded yesterday is the closest support level. Investors are hoping for a rebound from this level to halt the crypto market’s recent sharp decline.
The TPO chart also displays several naked Point of Controls (nPOCs) which are important resistance levels if Bitcoin price manages to bounce. These barriers include the $102,600, $103,600, and $104,600 levels.
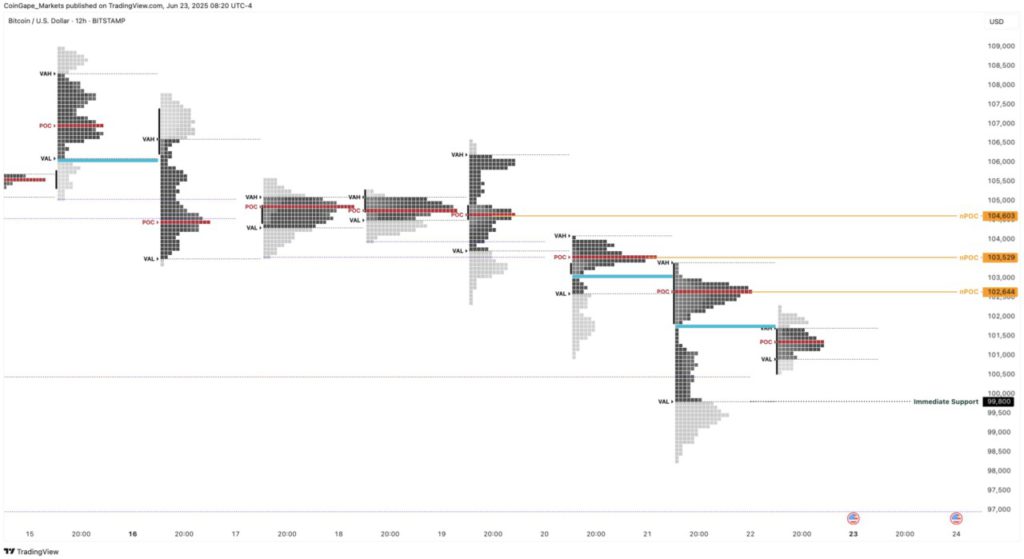
In addition, there is also a supply zone in the range of $104,500-$107,200 which is a crucial area and could trigger a price reversal.
Due to the strength of these resistance levels, the short-term outlook suggests that a rise towards the all-time high of $112,000 seems unlikely unless these barriers are broken.
Concerns on Market Structure
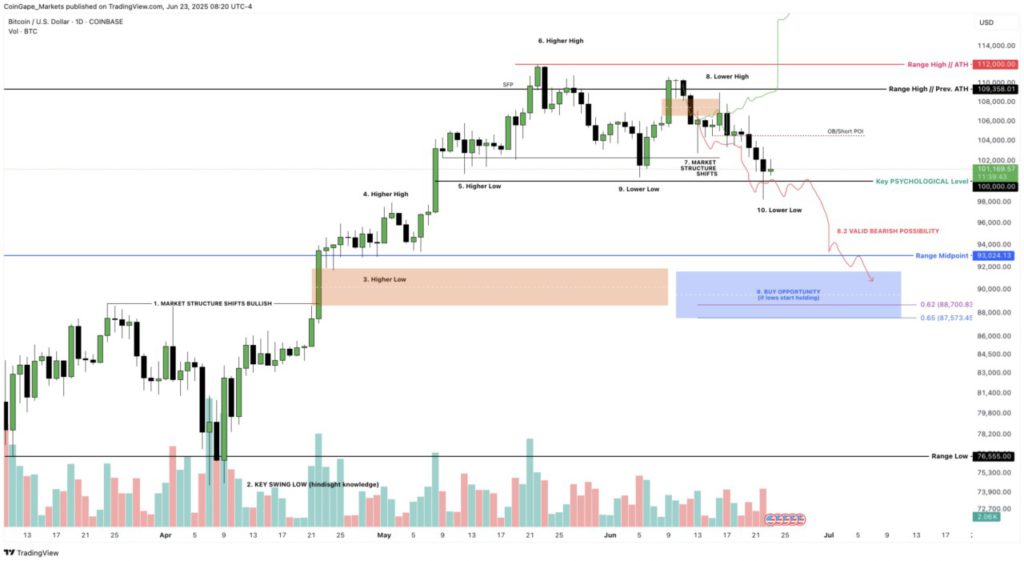
While the TPO chart gives an idea of traders’ expectations in the short term, the daily chart gives a clearer view of the weakening BTC market structure and what might happen next.
Read also: The Team Behind the Coin TRUMP Meme Moves $32.8 Million to Binance, What’s Up?
The price movement of BTC shows a bearish pattern that started to form since it reached an all-time high (ATH) at $112,000. After that, BTC printed a lower high at $110,651, followed by a lower low at $100,377, and the latest lower low at $98,225.
This series of lower lows and lower highs indicates that Bitcoin’s market structure has turned bearish.
Despite the bearish signals, the price recovery above $100,000 indicates that there is still demand remaining. Currently, the price is between crucial technical levels, making the next 24 to 48 hours a very decisive period for the next trend direction.
Is Bitcoin’s All-Time High (ATH) Possible This Week?
The likelihood of Bitcoin reaching an all-time high (ATH) this week is low, given that the current BTC price is down almost 10% from its peak. In addition, TPO analysis shows that there are a number of obstacles piling up to the $105,000 level.
As long as these levels are not broken, it is difficult to make a definitive long-term prediction on Bitcoin price for this week.
On the other hand, BTC’s daily price chart shows that if this downward trend continues and the $100,000 level is broken, it is very likely that Bitcoin will retest the support level at $93,024.
Beyond that, investors can anticipate a strong bottom forming in the zone between $87,509 to $91,653.
That’s the latest information about crypto. Follow us on Google News to stay up-to-date on the world of crypto and blockchain technology.
Enjoy an easy and secure crypto trading experience by downloading Pintu crypto app via Google Play Store or App Store now. Also, experience web trading with advanced trading tools such as pro charting, various types of order types, and portfolio tracker only at Pintu Pro. Pintu Pro Futures is also available, where you can buy bitcoin leverage, trade btc futures, eth futures and sol futures easily from your desktop!
*Disclaimer
This content aims to enrich readers’ information. Pintu collects this information from various relevant sources and is not influenced by outside parties. Note that an asset’s past performance does not determine its projected future performance. Crypto trading activities have high risk and volatility, always do your own research and use cold cash before investing. All activities of buying and selling bitcoin and other crypto asset investments are the responsibility of the reader.
Reference:
- Coingape. Can BTC Price Hit ATH Soon? Here’s the Analysis. Accessed on June 24, 2025
Latest News
© 2026 PT Pintu Kemana Saja. All Rights Reserved.
The trading of crypto assets is carried out by PT Pintu Kemana Saja, a licensed and regulated Digital Financial Asset Trader supervised by the Financial Services Authority (OJK), and a member of PT Central Finansial X (CFX) and PT Kliring Komoditi Indonesia (KKI). Crypto asset trading is a high-risk activity. PT Pintu Kemana Saja do not provide any investment and/or crypto asset product recommendations. Users are responsible for thoroughly understanding all aspects related to crypto asset trading (including associated risks) and the use of the application. All decisions related to crypto asset and/or crypto asset futures contract trading are made independently by the user.