Is Shiba Inu Set for a Comeback? Bullish Reversal Pattern Could Send SHIB Soaring to $0.000017!
Jakarta, Pintu News – Shiba Inu (SHIB) had a rough weekend, as the United States’ attack on Iran triggered a panic sell-off and massive liquidation across crypto markets.
The Shiba Inu price on June 23 was trading at $0.0000107 with a 24-hour trading volume of $242 million. This latest drop brings SHIB’s monthly loss to 25%.
Despite facing bearish market pressure, a double bottom pattern – which usually signals a reversal to a bullish trend – started to form. The buyers(bulls) are currently defending the crucial support level and aiming for $0.000017.
Shiba Inu Price Recovery Lurks as Bullish Pattern Forms
Reporting from Coingape (23/6), the weekly chart shows that the price of Shiba Inu is trying to recover losses after touching the support level at $0.0000106.
Read also: Shiba Inu Price Forecast: From $0.01 to $1, When will SHIB soar?
This support level has absorbed selling pressure over the past year, supporting multiple bounces and recovery rallies, and could be an attractive entry point for buyers speculating on a rebound.
Since the downtrend that began in December 2024, SHIB has twice held this support level, which then formed a double bottom pattern. The last time the price bounced off this level was in April 2025, and the resulting rally created a neckline resistance at $0.0000173.
If the price of this top coin meme follows the historical pattern and bounces back, it will attempt to retest the $0.000017 level. A convincing weekly candlestick close above the neckline will confirm the formation of a double bottom pattern.
To achieve this, the SHIB token price needs to increase by about 64% from its current position.
Middle Shiba Inu’s RSI is at Level 38
The theoretical target of the double bottom pattern is at $0.0000283, which is obtained by adding the distance between the bottom and the neckline to the breakout point at $0.0000173. A more aggressive bullish target is at the beginning of this downtrend, at $0.0000322.
In both scenarios, a strong price close above the neckline resistance, accompanied by a surge in spot buying volume, could push SHIB tokens to reach that price target.
For the double bottom pattern to really form and show a recovery like the one in April, the RSI indicator must also show higher lows and form a bullish divergence to confirm that buyers are starting to enter the market. Currently, the RSI is at an oversold level of 38.
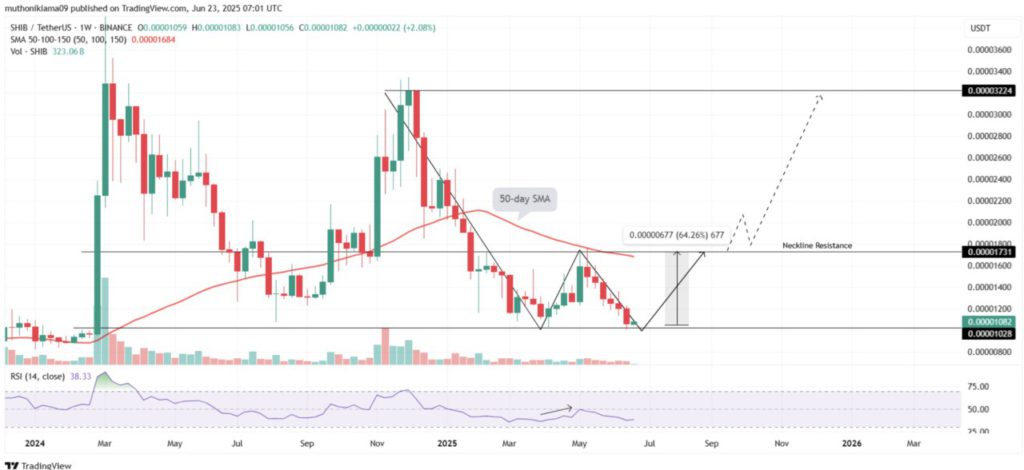
However, it is important to note that SHIB ‘s 50-day Simple Moving Average (SMA) is still above the price, signaling that the short-term momentum is still bearish. Until the Shiba Inu price breaks this level at $0.0000168, thebears are likely to remain in control.
In addition, a recent analysis from the CoinGape website noted that SHIB is at risk of a 50% drop if it loses the support level at $0.00001. If this scenario occurs, the double bottom pattern formation will be declared invalid.
Read also: Robert Kiyosaki Warned Bitcoin Would Crash — You Won’t Believe What Happened Next!
SHIB Funding Rate Turns Negative
Shiba Inu’sfunding rate, a metric used to measure market sentiment, has now turned negative. When this happens, it usually forms a bearish narrative towards Shiba Inu’s price projection as more traders bet the price will drop by opening short positions.
According to data from Santiment, the SHIB funding rate has dropped to its lowest level since April, indicatingovercrowded short positioning.
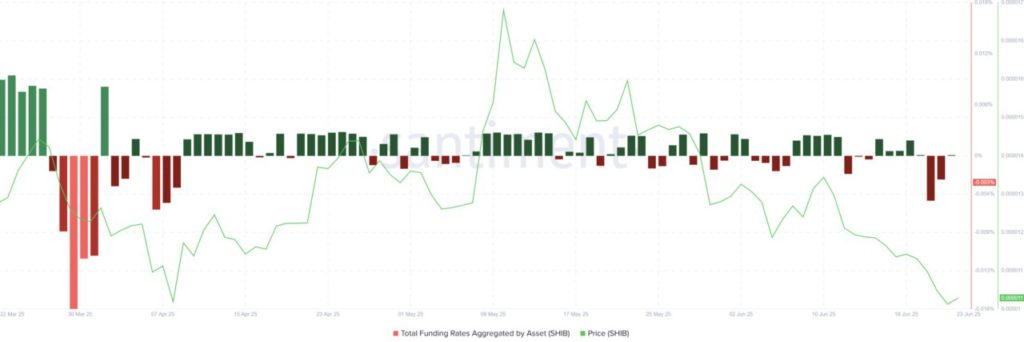
While this may seem negative, it can actually be a bullishsignal – becauseif prices start to recover and shorts are covered, buying pressure can surge sharply due to short covering.
In addition, this negative funding level reflects market conditions similar to last April, just before Shiba Inu prices rose and tested neckline resistance at $0.000017.
In conclusion, the Shiba Inu price has the potential to recover after losing more than 25% of its value within a month.
With the formation of a double bottom pattern and increasing short positions, a recovery towards $0.000017 seems to be in sight.
That’s the latest information about crypto. Follow us on Google News to stay up-to-date on the world of crypto and blockchain technology.
Enjoy an easy and secure crypto trading experience by downloading Pintu crypto app through Google Play Store or App Store now. Also, experience web trading with advanced trading tools such as pro charting, various types of order types, and portfolio tracker only at Pintu Pro. Pintu Pro Futures is also available, where you can buy bitcoin leverage, trade btc futures, eth futures and sol futures easily from your desktop!
*Disclaimer
This content aims to enrich readers’ information. Pintu collects this information from various relevant sources and is not influenced by outside parties. Note that an asset’s past performance does not determine its projected future performance. Crypto trading activities have high risk and volatility, always do your own research and use cold cash before investing. All activities of buying and selling bitcoin and other crypto asset investments are the responsibility of the reader.
Reference:
- Coingape. Can Shiba Inu Price Recover to $0.000017 as Bullish Reversal Pattern Takes Shape. Accessed on June 24, 2025
Latest News
© 2026 PT Pintu Kemana Saja. All Rights Reserved.
The trading of crypto assets is carried out by PT Pintu Kemana Saja, a licensed and regulated Digital Financial Asset Trader supervised by the Financial Services Authority (OJK), and a member of PT Central Finansial X (CFX) and PT Kliring Komoditi Indonesia (KKI). Crypto asset trading is a high-risk activity. PT Pintu Kemana Saja do not provide any investment and/or crypto asset product recommendations. Users are responsible for thoroughly understanding all aspects related to crypto asset trading (including associated risks) and the use of the application. All decisions related to crypto asset and/or crypto asset futures contract trading are made independently by the user.