5 Cryptos Worth Considering in 2025
Jakarta, Pintu News – The year 2025 could be a watershed moment for crypto investors looking to achieve financial freedom. Despite the market turmoil, there are a number of crypto assets that show great potential to bounce back during the next bull run.
Some of them are Avalanche (AVAX), Chainlink (LINK), NEAR Protocol (NEAR), MANTRA (OM), and VeChain (VET).
This article reviews the current conditions of these five assets, including support and resistance levels, to help you make more informed investment decisions.
1. Avalanche (AVAX)
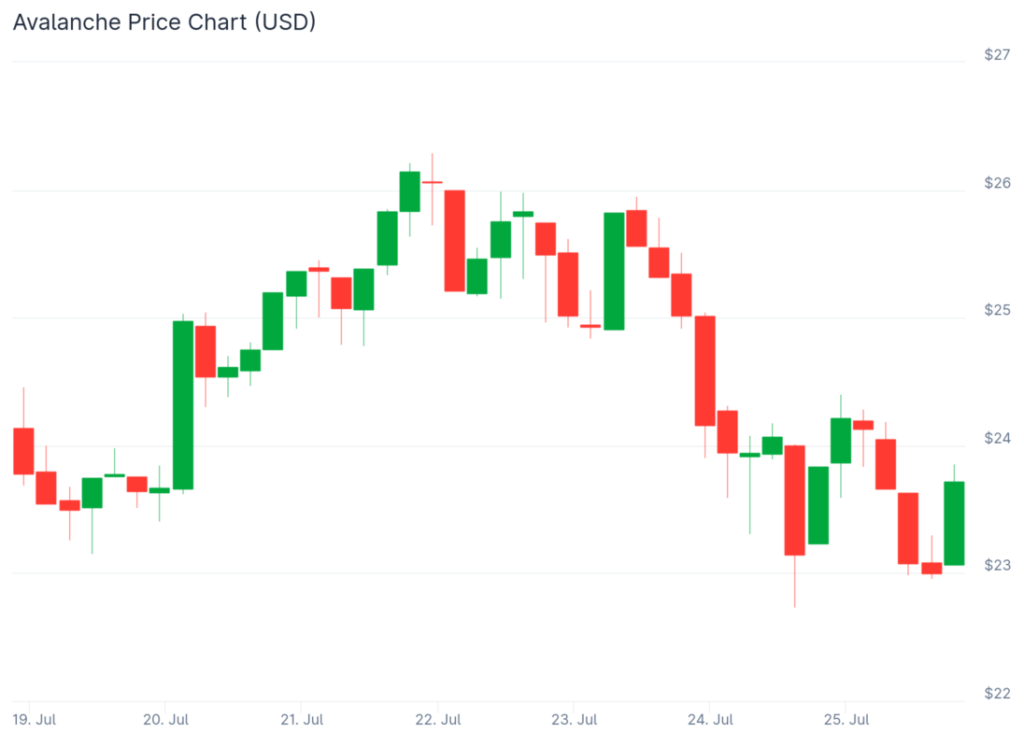
The Avalanche (AVAX) price chart in the time span of July 19 to 25 shows a fairly volatile movement with a downward trend at the end of the period. Initially, the price of AVAX experienced a significant increase on July 20, marked by a long green candle that pushed the price through the $25 level. This increase continued moderately until it peaked near $26 on July 22.
However, starting on July 23, selling pressure began to mount and the price of AVAX underwent a gradual correction. The decline continued until it touched the area around $23 on July 24. Although there was an attempt at a rebound with some green candles, selling pressure dominated again, making it difficult for the price to stay above $24. This chart reflects the bearish market sentiment in the short term, with AVAX closing near the support level around $23.
2. Chainlink (LINK)
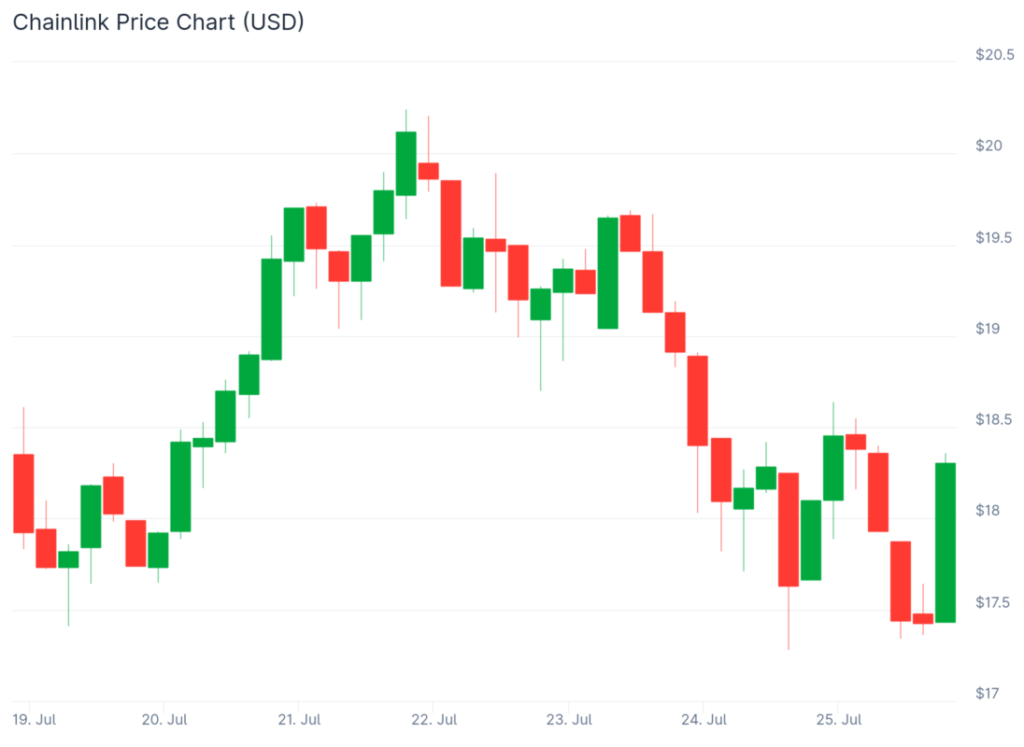
The Chainlink (LINK) price chart for the period July 19 to 25 shows a fairly sharp movement pattern, with a significant upward phase followed by a deep downward trend. At the beginning of the chart, LINK was gradually strengthening, forming consecutive green candles that brought the price up from around $17.5 to a high near $20.5 on July 22.
However, after reaching its peak, selling pressure started to increase consistently. Since July 23, the chart began to be dominated by red candles showing a price correction back to the area around $17.5. This decline reflects profit-taking and reduced buying momentum after the previous rapid rise.
Towards the end of the chart, there was a long green candle on July 25, indicating a potential rebound from the support area. However, volatility is still high, and further price movement will largely depend on market sentiment and trading volume in the next few days.
Read also: 3 Reasons from Analysts Why Pi Network Hasn’t Listed on Binance Yet
3. NEAR Protocol (NEAR)
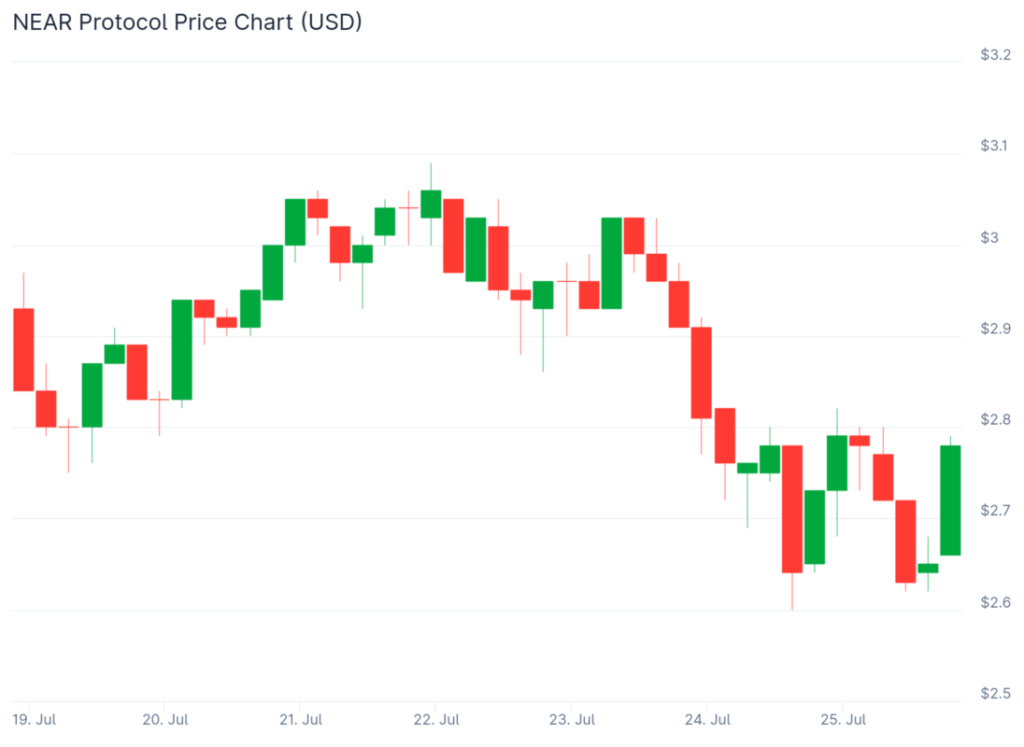
The NEAR Protocol (NEAR) price chart for the period July 19 to 25, 2025 shows a fairly volatile pattern, with an initial strengthening trend followed by a significant correction. In the first half of the chart, the NEAR price experienced a gradual strengthening, rising from the area around $2.60 to break the $3.10 level on July 22. This increase was evident from the dominance of green candles reflecting strong buying pressure.
However, since July 23, the trend began to reverse. The consistent appearance of red candles signaled increasing selling pressure. The price of NEAR experienced a gradual decline, until it again touched the area around $2.60 on July 24, marking the lowest point in the period. This indicates profit-taking after the previous surge.
Towards the end of the chart, on July 25, a large green candle appeared signaling a potential recovery. The price started to bounce back to the $2.75-$2.80 range. Although selling pressure is still visible, the emergence of this buying momentum could be an early indication of recovery if supported by higher volumes in the next few days.
4. MANTRA (OM)
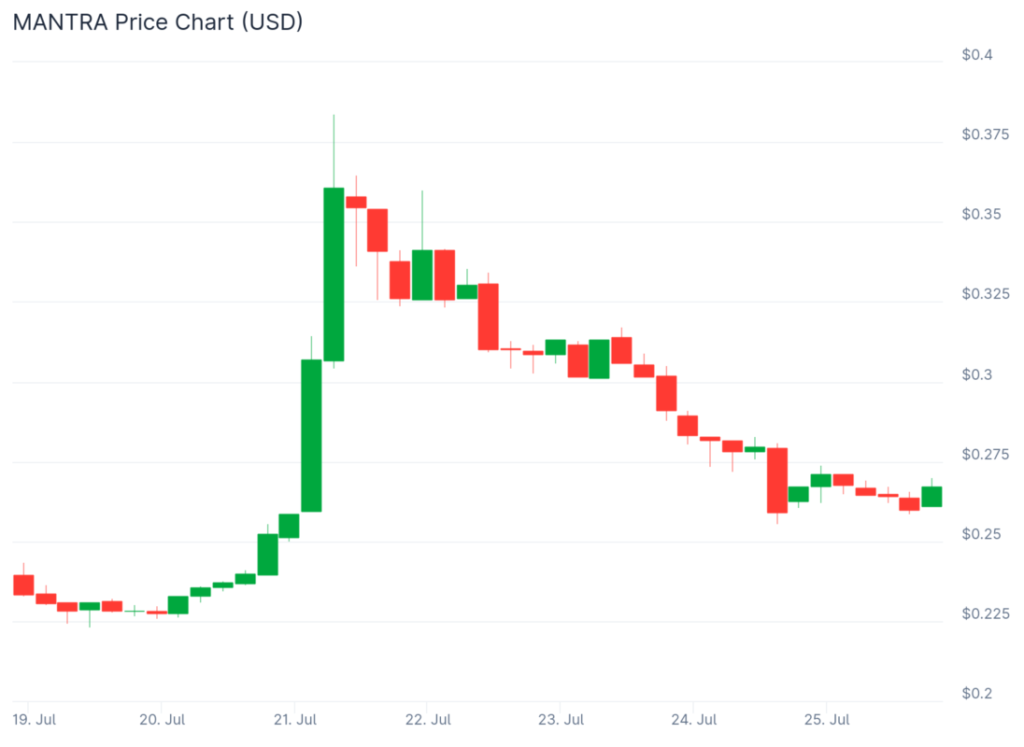
The price chart of MANTRA (OM) from July 19 to 25, 2025 shows a very sharp movement pattern, starting with a significant spike and followed by a deep correction phase.
At the beginning of the period, OM prices were flat and tended to stagnate below the $0.25 level. However, entering July 21, there was a very strong price spike, characterized by a large green candle that brought the price through the $0.35 area. This spike reflected a certain positive sentiment or catalyst that prompted massive buying interest from market participants.
After peaking above $0.38, the trend reversed. The correction started on July 22, as evidenced by the dominance of red candles that continued for several days. The price slowly dropped from the peak area, returning to around $0.26-$0.27 on July 25. This decline suggests that the market is experiencing profit-taking or running out of buying momentum after the sharp rally.
Overall, the chart depicts a classic “pump and dump” pattern-where the price spikes dramatically for a short period of time, then corrects deeply as buying pressure wanes. Although the price is now starting to stabilize slightly, the next direction will largely depend on whether buyers are able to hold the support level around $0.25.
Also read: 4 Crypto Rankings that are on the Rise in 2025
5. VeChain (VET)
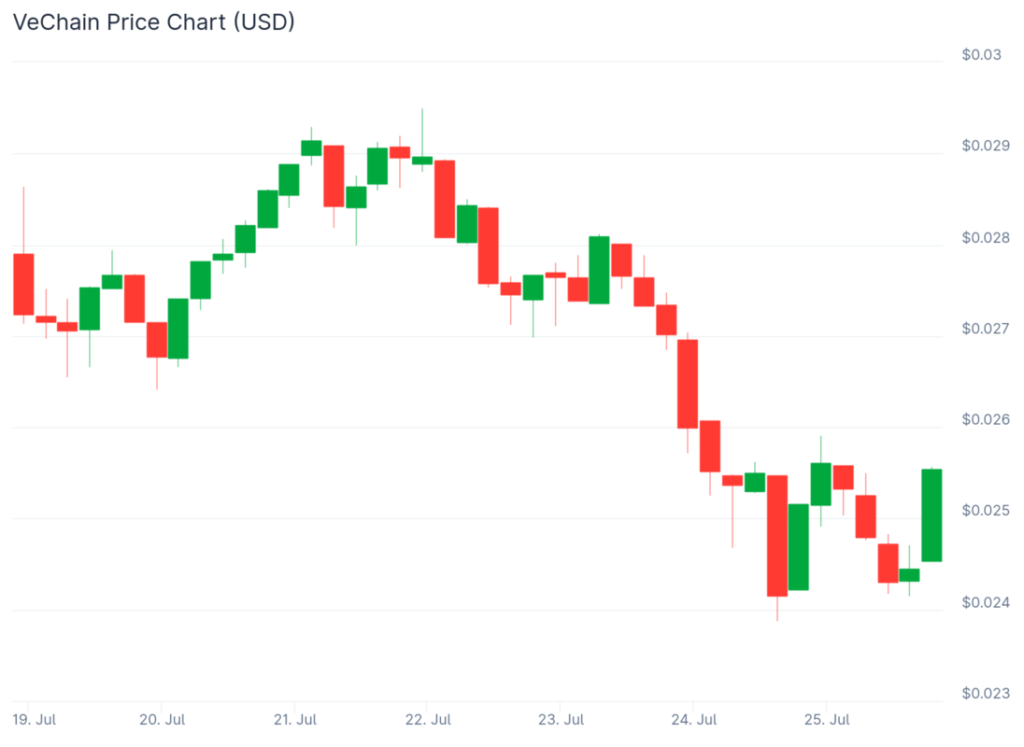
The VeChain (VET) price chart in the time span from July 19 to 25, 2025 shows a fairly dynamic movement pattern, with a tendency to weaken after having strengthened.
At the beginning of the period, the price of VET experienced a gradual strengthening until it reached a high near $0.029 on July 21-22. This uptrend was characterized by a series of green candles that reflected the dominance of buying by market participants. However, after reaching this peak, selling pressure began to increase.
Since July 22, the chart began to be dominated by red candles, signaling a fairly consistent downward trend. The price of VET continued to decline gradually until it hit a low near $0.024 on July 25. This decline reflects a correction phase or possible profit-taking by investors after the previous rise.
Interestingly, at the end of the chart period, there was a fairly strong green candle, indicating a potential short-term rebound from the support level. This suggests that there is a buying effort to arrest further declines, although it still needs confirmation from volume and subsequent price movements.
Overall, this chart reflects that VeChain is in a consolidation phase after an uptrend, and investors need to watch the resistance level around $0.027 and support at $0.024 as important areas for the next direction of movement.
Conclusion
Although the crypto market is in a correction phase, five assets such as AVAX, LINK, NEAR, OM, and VET still show strong recovery potential in the medium to long term. By considering support levels, resistance, and technical indicators such as RSI, investors can take advantage of this moment to make smart accumulations.
That’s the latest information about crypto. Follow us on Google News to get the latest information about the world of crypto and blockchain technology. Check today‘ s bitcoin price, today’s solana price, pepe coin and other crypto asset prices through Pintu Market.
Enjoy an easy and secure crypto trading experience by downloading Pintu crypto app via Google Play Store or App Store now. Also, get a web trading experience with various advanced trading tools such as pro charting, various types of order types, and portfolio tracker only at Pintu Pro.
*Disclaimer
This content aims to enrich readers’ information. Pintu collects this information from various relevant sources and is not influenced by outside parties. Note that an asset’s past performance does not determine its projected future performance. Crypto trading activities have high risk and volatility, always do your own research and use cold cash before investing. All activities of buying and selling bitcoin and other crypto asset investments are the responsibility of the reader.
Reference:
- Tron Weekly. Invest $100, Retire in a Mansion? These 6 Cryptos Could Do It! Accessed July 26, 2025
- Featured Image: Generated by AI
Latest News
© 2026 PT Pintu Kemana Saja. All Rights Reserved.
The trading of crypto assets is carried out by PT Pintu Kemana Saja, a licensed and regulated Digital Financial Asset Trader supervised by the Financial Services Authority (OJK), and a member of PT Central Finansial X (CFX) and PT Kliring Komoditi Indonesia (KKI). Crypto asset trading is a high-risk activity. PT Pintu Kemana Saja do not provide any investment and/or crypto asset product recommendations. Users are responsible for thoroughly understanding all aspects related to crypto asset trading (including associated risks) and the use of the application. All decisions related to crypto asset and/or crypto asset futures contract trading are made independently by the user.