What is the Envelope Indicator? How to Use It?
Jakarta, Pintu News – In the world of trading, understanding price movements is key to making the right decisions. One of the technical analysis tools that many professional and beginner traders use is the Envelope indicator.
It helps identify price areas that are considered overbought or oversold, while providing a visual representation of market trends.
What is the Envelope Indicator?
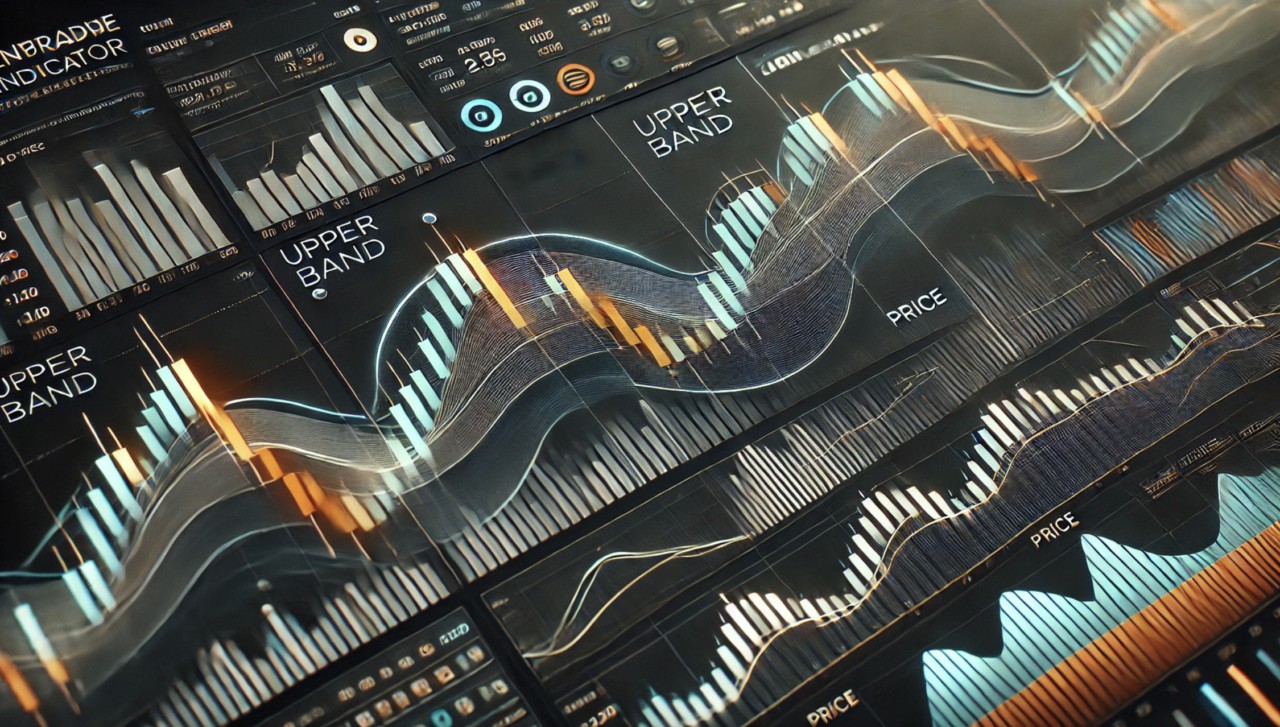
The Envelope Indicator is one of the technical analysis tools that traders use to gauge price movements and help determine potential buy or sell areas.
This indicator works by placing two lines (bands) above and below the Moving Average line. The two lines form an “envelope” that follows the price movement.
Read also: Commodities: Types and Their Role in Economics and Investment!
In general:
- The Upper Band (upper limit) shows a potentially overbought area (the price is too high so it is likely to fall or correct).
- The Lower Band shows a potentially oversold area (the price is too low so it is likely to rise).
How it Works:
- If the price moves to touch or cross the Upper Band, this could be a signal for take profit or sell consideration.
- If the price touches or crosses the Lower Band, this could be a signal to buy.
- The distance between the Upper Band and Lower Band is affected by market volatility-the higher the volatility, the wider the distance.
Main Functions of Envelope Indicator
- Identify trends and changes in price direction.
- Determine potential entry (buy) and exit (sell) areas.
- Measure the level of market volatility.
- Become a reference for rebound or breakout strategies.
How to Use the Envelope Indicator
Here’s a complete and practical explanation of how to use the Envelopes indicator for forex, stocks, or crypto trading:
Understand the Components of the Envelopes Indicator
The Envelopes indicator consists of:
- Moving Average (MA) → depicts the average price trend.
- Upper Band → MA price + a certain percentage deviation.
- Lower Band → MA price – a certain percentage deviation.
Example: A 20-period MA with a 2% deviation means that the upper band is 2% above the MA and the lower band is 2% below the MA.
Determining the Right Parameters
The default settings in MetaTrader or TradingView are usually:
- Period MA: 20
- MA Type: Simple Moving Average (SMA) or Exponential Moving Average (EMA)
- Deviation: 1-3% (adjust for market volatility)
- Apply to: Close price
The higher the deviation → the wider the band.
The lower the deviation → the narrower the band.
Read also: xStocks Records $2 Billion Cumulative Trading Volume, TSLAx Leads Stock Tokenization Market?
Signal Interpretation
a) Rebound Strategy
- Buy → When the price touches or breaks the Lower Band and then bounces upwards.
- Sell → When the price touches or breaks the Upper Band and then bounces down.
b) Breakout Strategy
- Buy → When the price breaks the Upper Band accompanied by high volume → indication of a strong uptrend.
- Sell → When the price breaks the Lower Band with high volume → an indication of a strong downtrend.
Use with Other Indicators
Envelopes are best combined with:
- RSI → overbought/oversold confirmation.
- MACD → see the strength of the trend.
- Volume → measures the validity of the breakout.
Usage Example in MetaTrader 4/5
- Open the chart of the pair or stock you want to analyze.
- Click Insert → Indicators → Trend → Envelopes.
- Enter the parameters according to the strategy.
- Observe the price position against the upper and lower bands.
- Execution of orders according to signals and confirmation of additional indicators.
Optimization Tips
- Test different parameters in backtesting before using them on a real account.
- Use timeframes that match the strategy (scalping → M5/M15, swing → H4/Daily).
- Avoid opening positions based solely on Envelopes without confirmation of other signals.
To maximize your trading strategy, especially crypto, you need a platform that provides complete and flexible trading tools.
In addition to technical indicators such as Envelopes, traders also need support such as various order types (Post Only, GTC, IOC, FOK), detailed price charts for analysis, and sound portfolio management.
One platform that already provides a variety of tools is Pintu Pro. This service is available on both the Pintu app and desktop web version, so you can trade anywhere with a comfortable experience.
With Pintu Pro, you can analyze charts directly, place orders according to your strategy, and monitor your portfolio in real time-all in one ecosystem.
So, if you want to try trading with a full suite of tools and a professional look, Pintu Pro could be the right choice to support your trading decisions.
That’s the latest information about crypto. Follow us on Google News to get the latest information about the world of crypto and blockchain technology. Check today‘ s bitcoin price, today‘ s solana price, pepe coin and other crypto asset prices through Pintu Market.
Enjoy an easy and secure crypto trading experience by downloading Pintu crypto app via Google Play Store or App Store now. Also, get a web trading experience with various advanced trading tools such as pro charting, various types of order types, and portfolio tracker only at Pintu Pro.
*Disclaimer
This content aims to enrich readers’ information. Pintu collects this information from various relevant sources and is not influenced by outside parties. Note that an asset’s past performance does not determine its projected future performance. Crypto trading activities have high risk and volatility, always do your own research and use cold cash before investing. All activities of buying and selling bitcoin and other crypto asset investments are the responsibility of the reader.
Latest News
© 2026 PT Pintu Kemana Saja. All Rights Reserved.
The trading of crypto assets is carried out by PT Pintu Kemana Saja, a licensed and regulated Digital Financial Asset Trader supervised by the Financial Services Authority (OJK), and a member of PT Central Finansial X (CFX) and PT Kliring Komoditi Indonesia (KKI). Crypto asset trading is a high-risk activity. PT Pintu Kemana Saja do not provide any investment and/or crypto asset product recommendations. Users are responsible for thoroughly understanding all aspects related to crypto asset trading (including associated risks) and the use of the application. All decisions related to crypto asset and/or crypto asset futures contract trading are made independently by the user.