3 Memecoins Making Headlines This Week Based on Chart Analysis
Jakarta, Pintu News – According to Crypto News, meme coins SPX6900, PEPE, and MOODENG are all showing strong technical patterns, with important resistance levels that may be broken as soon as this week.
With that in mind, let’s take a look at which project is most poised for the next big move, according to its chart analysis.
SPX6900 Price Prediction
The price of SPX6900 (SPX6900) is currently retesting a key breakout zone after successfully breaking out of a bullish cup and handle formation. After the breakout above the rim level around the $1.73-$1.77 range, the price surged to peak at $2.28 in late July.
Read also: Pi Network and Bitcoin’s Falling Correlation Leads to Mass Exodus of Pi Coin Holders
Then, the price dropped to $1.42, briefly below the breakout zone. However, this looks more like a shakeout than a complete invalidation, as the SPX6900 price has since recovered back to the breakout level and is currently testing the $1.77 area.
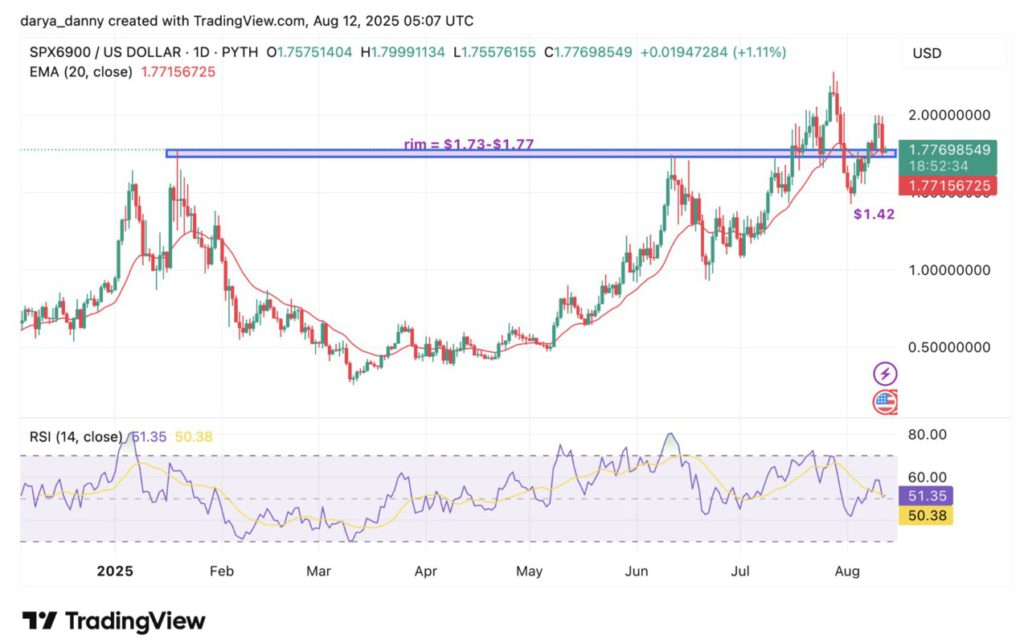
Moreover, the drop to $1.42 is relatively shallow compared to the depth of the cup. Plus, the price has now reclaimed the 20-day EMA, which suggests that the bullish structure still remains intact.
If buyers can hold this level, the next move could be to target a new higher price, potentially crossing the $2.28 range. However, if the price closes the day below the breakout zone, this could be a warning signal that this pattern may fail.
PEPE Price Prediction
PEPE (PEPE) price is consolidating within a bullish ascending triangle formation, with clear horizontal resistance in the $0.000015-$0.000016 range. The structure of this pattern suggests accumulation, with sellers unable to push the price below the rising trendline, indicating steady demand.
On August 12, PEPE briefly traded at $0.00001148, right at the 20-day EMA, while consolidating after a failed attempt to break the triangle top in late July.
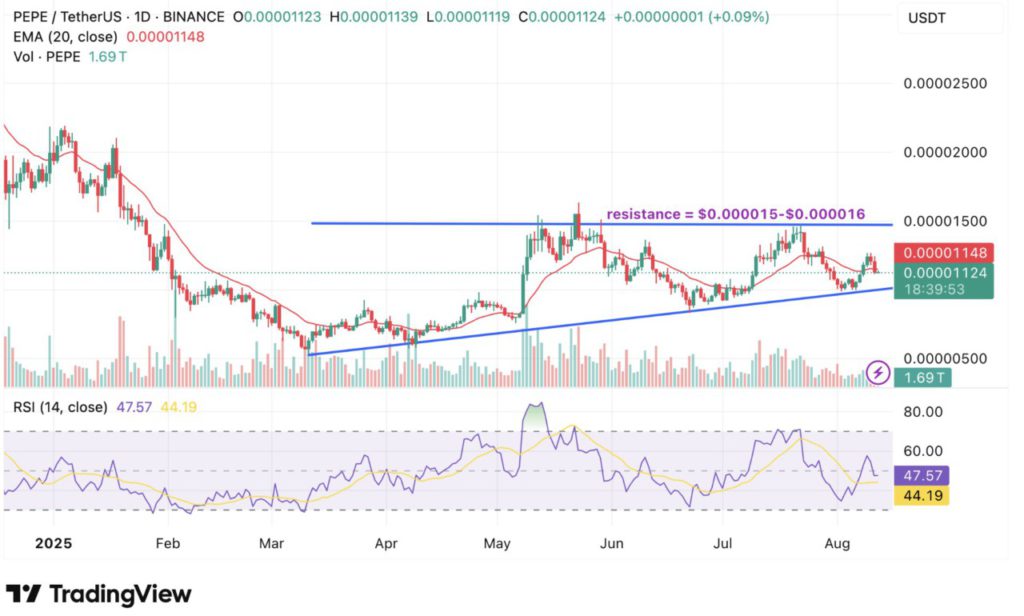
A convincing breakout above the resistance, which is only about 30-35% away, could trigger a move higher.
If the breakout occurs with strong volume and is followed by a follow-through move, this will activate the move target measured from the height of the triangle (~$0.0000274, which is about 70% upside from resistance).
However, if the price closes the day below the ascending trendline, this would be a signal that the bullish structure may be failing and could open up the possibility of a deeper correction.
Read also: Whale Buys 320 Million XRP, Can Ripple Price Pass $3.50 Level?
MOODENG Price Prediction
Moo Deng (MOODENG) price is consolidating within a symmetrical triangle pattern, with support and resistance lines approaching each other, suggesting a period of compression before a potential breakout.
The upper limit of the triangle currently restricts price movement around the $0.25 level, while the lower support line recently held around $0.15.
After a volatile move towards $0.35 in May, theecoin cooled down but continued to print higher lows, indicating that buyers remained active despite the consolidation phase.
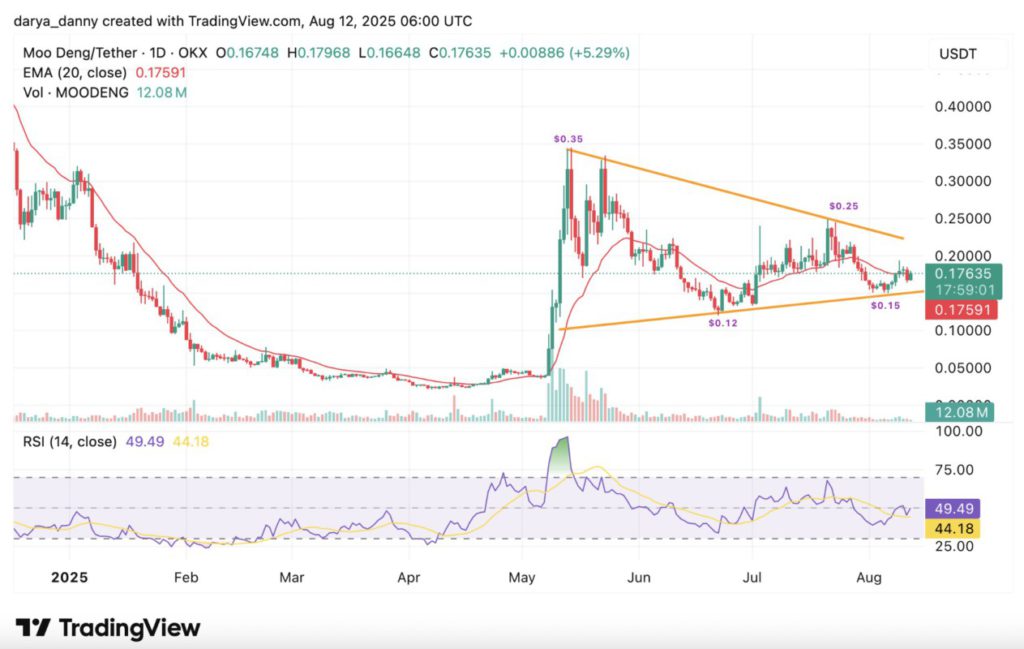
As of August 12, MOODENG’s price was hovering around $0.18, slightly below the 20-day EMA, with an RSI reading of around 49 – indicating neutral momentum and a balanced tug-of-war between bulls and bears.
This pattern can breakout in either direction, but with Binance Coin (BNB) recently registering a new ATH and the general market sentiment being bullish, it is more likely that the price movement will be to the upside.
A convincing close above the upper border of the triangle around $0.25 with strong volume would confirm the breakout and activate the target move towards the $0.47 area, reflecting a 160% upside from the current price. However, a clear daily close below the $0.15 support would invalidate this bullish setup.
That’s the latest information about crypto. Follow us on Google News to get the latest information about the world of crypto and blockchain technology. Check today‘ s bitcoin price, today’s solana price, pepe coin and other crypto asset prices through Pintu Market.
Enjoy an easy and secure crypto trading experience by downloading Pintu crypto app via Google Play Store or App Store now. Also, get a web trading experience with various advanced trading tools such as pro charting, various types of order types, and portfolio tracker only at Pintu Pro.
*Disclaimer
This content aims to enrich readers’ information. Pintu collects this information from various relevant sources and is not influenced by outside parties. Note that an asset’s past performance does not determine its projected future performance. Crypto trading activities have high risk and volatility, always do your own research and use cold cash before investing. All activities of buying and selling bitcoin and other crypto asset investments are the responsibility of the reader.
Reference:
- Crypto News. Memecoins to watch for a breakout this week: SPX6900, PEPE, MOODENG. Accessed on August 15, 2025
Latest News
© 2025 PT Pintu Kemana Saja. All Rights Reserved.
The trading of crypto assets is carried out by PT Pintu Kemana Saja, a licensed and regulated Digital Financial Asset Trader supervised by the Financial Services Authority (OJK), and a member of PT Central Finansial X (CFX) and PT Kliring Komoditi Indonesia (KKI). The trading of crypto asset futures contracts is carried out by PT Porto Komoditi Berjangka, a licensed and regulated Futures Broker supervised by BAPPEBTI, and a member of CFX and KKI. Crypto asset trading is a high-risk activity. PT Pintu Kemana Saja and PT Porto Komoditi Berjangka do not provide any investment and/or crypto asset product recommendations. Users are responsible for thoroughly understanding all aspects related to crypto asset trading (including associated risks) and the use of the application. All decisions related to crypto asset and/or crypto asset futures contract trading are made independently by the user.

