What to Expect from Ethereum in September: Is Volatility on the Horizon?
Jakarta, Pintu News – Ethereum (ETH) price seems to have ended the month of August on a strong note, registering a gain of over 23% and breaking the negative trend of three consecutive years in August.
In contrast to Bitcoin (BTC), which struggled throughout the month, ETH prices showed resilience.
However, historically, September is one of the weaker periods for Ethereum. In 2024, ETH only recorded a slight increase of 3.20%, and 1.49% in 2023, having previously experienced several Septembers that closed in the red.
Now, with mixed technical signals, ETH could potentially face a turbulent September.
Long-term Holders May Realize Gains

One important metric to note is Ethereum’s Net Unrealized Profit/Loss (NUPL), which measures the level of unrealized gains or losses by asset holders.
Read also: Ethereum Price Falls to $4,300 on September 1st: Whales Exit as Spot Market Heats Up!
A high NUPL indicates that most wallets are in a profit position – this is often a signal that some investors may be about to take profits. Currently, Ethereum’s long-term holder NUPL stands at 0.62, near the highest level in the last three months.
In the past, similar levels have triggered price corrections. On August 17, when the NUPL reached 0.63, the ETH price dropped from $4,475 to $4,077 (down 8.9%). Later in the month, when the NUPL touched 0.66, the ETH price fell from $4,829 to $4,380 (down 9.3%). This shows that September has the potential to bring volatility or limited price movements within a certain range.
Historically, September is not the strongest period for Ethereum. This history, coupled with high NUPL numbers, supports the potential for volatile market conditions.

Nevertheless, Ethereum’s long-term fundamentals still provide hope for price increases. In an exclusive interview with the BeInCrypto website, Kevin Rusher, CEO of RAAC, explained:
“I expect the factors driving the Ethereum price in September to remain the same as they are today – most notably the trend of companies starting to buy ETH for their cash reserves. Even this week, Standard Chartered cited this as the main reason for raising its price target for ETH to $7,500,” he said.
This trend of accumulation for treasury purposes, along with Ethereum’s role in the DeFi sector and the tokenization of real-world assets (RWAs), may help cushion downward pressure on prices – although short-term volatility is still possible.
Base Cost Heatmap Highlights Critical Resistance Areas
Another important metric is the Cost Basis Heatmap, which shows where ETH was last accumulated. These zones often serve as natural support or resistance areas.
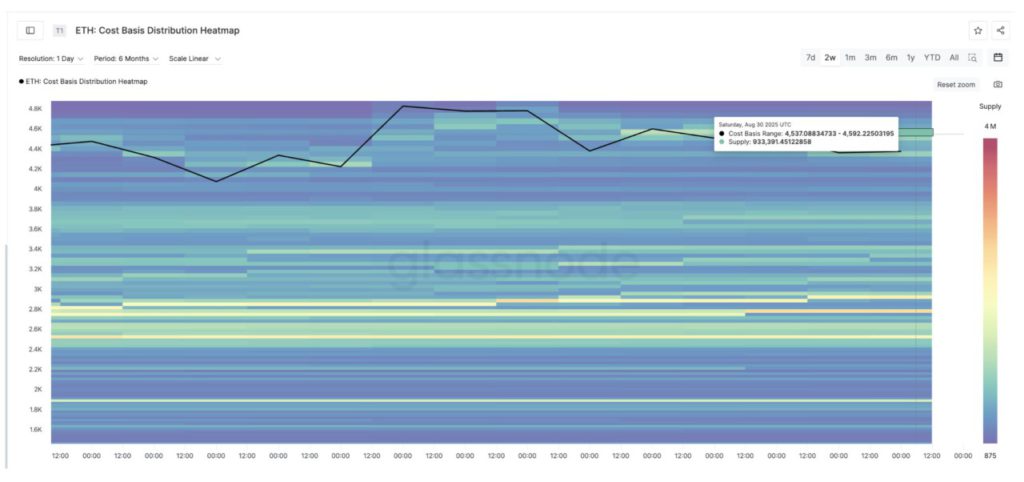
The strongest support cluster is in the range of $4,323 to $4,375, where more than 962,000 ETH has been accumulated. Below that, there are additional zones at $4,271-$4,323 (418,872 ETH) and $4,219-$4,271 (329,451 ETH), which could serve as a buffer if Ethereum price declines.
But the biggest challenge lies above it. In the price range of $4,482 to $4,592, nearly 1.9 million ETH has been accumulated – making this area a strong resistance zone.
If ETH price manages to break this level, the upward momentum could potentially continue towards $4,956. More details will be discussed in the next Ethereum price analysis section.
Read also: Grayscale Officially Files Polkadot and Cardano ETFs with the SEC!
Technical charts hint at volatile Ethereum price movement
Ethereum’s price chart on the 2-day timeframe shows that the price has broken the uptrend line. While this doesn’t confirm a trend reversal to bearish, it does indicate that bullish momentum is starting to weaken.
The Relative Strength Index (RSI) indicator, which measures the speed and strength of price movements, also formed a bearish divergence – where the price printed higher peaks, while the RSI declined.
Typically, it signals a weakening trend strength and increased potential forrange-bound movement, especially if the pattern appears on a longer timeframe.
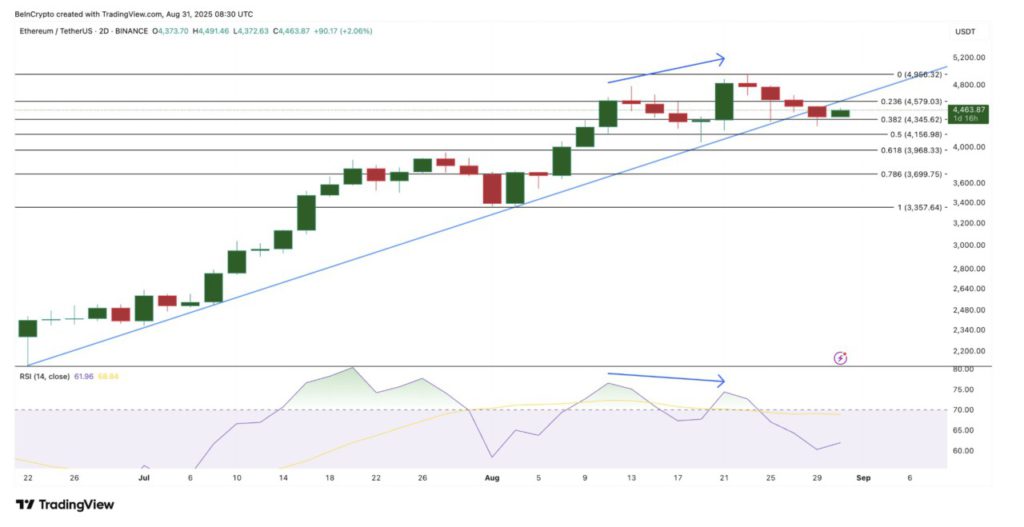
If ETH is able to break $4,579 again (close to the resistance zone on a cost basis), then the upward momentum could return, with the main target being at $4,956.
However, if it moves down, watch out for support levels at $4,345 and $4,156. A drop below $4,156 could open up further downside risks, while if ETH is able to hold above $4,579 consistently, the target of $4,956 – which is also close to the psychologically important $5,000 level – is still very much within reach.
For Ethereum, the $5,000 level is not just an ordinary target, but could be the start of a bigger phase, as explained by Kevin Rusher:
“Yes, $5,000 is still an important milestone. Psychologically, investors like round numbers, and this is also a new all-time high. Once ETH breaks $5,000, that level will later become a strong support that is maintained,” he added.
However, if Ethereum price closes below $4,156 with an intact 2-day candle, the bullish narrative will likely take longer to materialize.
With the NUPL of long-term holders nearing the highest level in the past three months, talk of volatility and price instability has gained further support.
That’s the latest information about crypto. Follow us on Google News to get the latest crypto news about crypto projects and blockchain technology. Also, learn crypto from scratch with complete discussion through Pintu Academy and stay up-to-date with the latest crypto market such as bitcoin price today, xrp coin price today, dogecoin and other crypto asset prices through Pintu Market.
Enjoy an easy and secure crypto trading experience by downloading Pintu crypto app via Google Play Store or App Store now. Also, get a web trading experience with various advanced trading tools such as pro charting, various types of order types, and portfolio tracker only at Pintu Pro.
*Disclaimer
This content aims to enrich readers’ information. Pintu collects this information from various relevant sources and is not influenced by outside parties. Note that an asset’s past performance does not determine its projected future performance. Crypto trading activities have high risk and volatility, always do your own research and use cold cash before investing. All activities of buying and selling bitcoin and other crypto asset investments are the responsibility of the reader.
Reference:
- BeInCrypto. Ethereum Price September 2025 Outlook. Accessed on September 1, 2025
Latest News
© 2026 PT Pintu Kemana Saja. All Rights Reserved.
The trading of crypto assets is carried out by PT Pintu Kemana Saja, a licensed and regulated Digital Financial Asset Trader supervised by the Financial Services Authority (OJK), and a member of PT Central Finansial X (CFX) and PT Kliring Komoditi Indonesia (KKI). Crypto asset trading is a high-risk activity. PT Pintu Kemana Saja do not provide any investment and/or crypto asset product recommendations. Users are responsible for thoroughly understanding all aspects related to crypto asset trading (including associated risks) and the use of the application. All decisions related to crypto asset and/or crypto asset futures contract trading are made independently by the user.