Whales and Smart Money Target 3 Made-in-USA Cryptos for Accumulation
Jakarta, Pintu News – The Made in USA Coin Index closed the first week of September with a gain of more than 7%, driven primarily by sharp jumps in tokens such as Worldcoin (WLD) and WLFI. However, while both are now facing the risk of a quick correction, the market focus is starting to shift to three other tokens.
Citing BeInCrypto’s report, all three tokens are showing strongly bullish chart patterns while attracting consistent fund flows from whale and large investors. Together, this signals a potential area ahead of a rate cut in September.
Chainlink (LINK)
The first coin on the Made in USA coins list that is in the spotlight right now is Chainlink (LINK). Over the past week, LINK’s movement has been quiet with a slight decline of 2.1%.
Read also: Whale Scoops Up 121K TRUMP Tokens as Retail Traders Exit — What’s Next?
In the past 30 days, LINK has only gained 5.6%, much more stable than the general crypto market. But despite the relatively flat price, accumulation activity has been substantial. During the period, whales increased their holdings by 28.48%, or about 1.10 million LINKs worth approximately $24.7 million at $22.40.
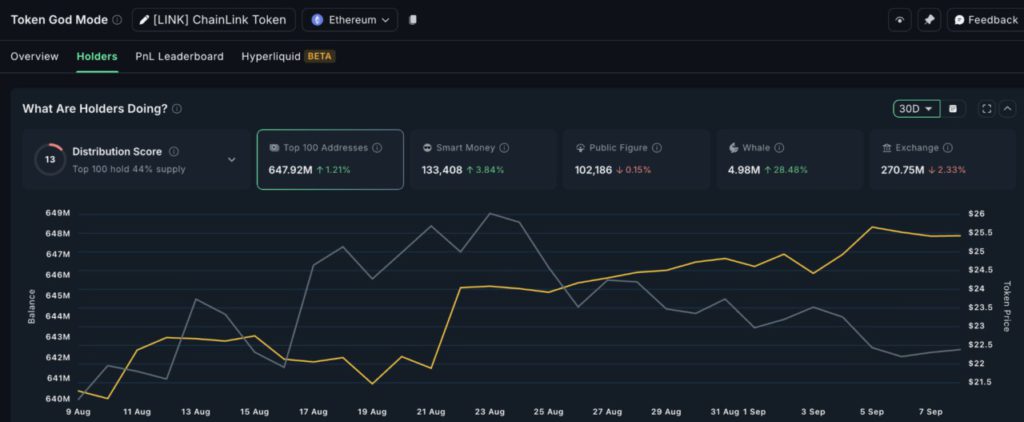
Data from crypto exchanges shows a more interesting trend: LINK balances on exchanges fell by 2.33%, equivalent to the movement of 6.46 million LINKs (about $145 million) out of the exchange. This means that not only whales, but also retail investors and small holders are withdrawing their tokens from the market.
On the technical side, the Relative Strength Index (RSI) indicator is giving important signals. RSI measures the strength of price movements on a scale of 0-100, with values below 30 indicating oversold conditions and above 70 indicating overbought.
What makes Chainlink stand out is the hidden bullish divergence. Between July 1 and August 2, LINK’s price formed a higher low, while the RSI declined. This pattern then triggered a rally that pushed the price from $15.41 to $27.84, an increase of about 80%.
A similar situation was seen again in the period from August 15 to September 4. This kind of divergence is often a signal that price strength is beginning to build behind the scenes, even though the chart appears calm.
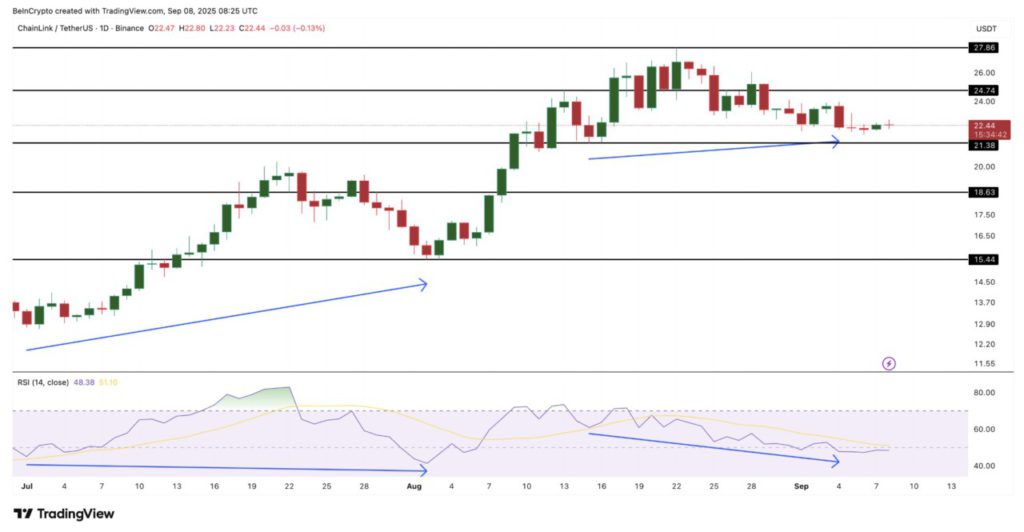
In terms of price levels, LINK currently has support at $21.38. If this level is broken, the next areas of potential support are at $18.63 and $15.44.
As for the upside, the resistance is at $24.74, and if the price manages to break clearly above $27.86, there is a great chance for LINK to continue its rally to higher levels.
Pudgy Penguins (PENGU)
The PENGU token associated with the Pudgy Penguins (PENGU) project corrected about 17% in the last 30 days. However, on September 8, 2025, its price actually increased by 8%, thus recording an 11.6% increase in the last 7 days. This performance puts PENGU as one of the Made in USA coins to watch in the second week of September.
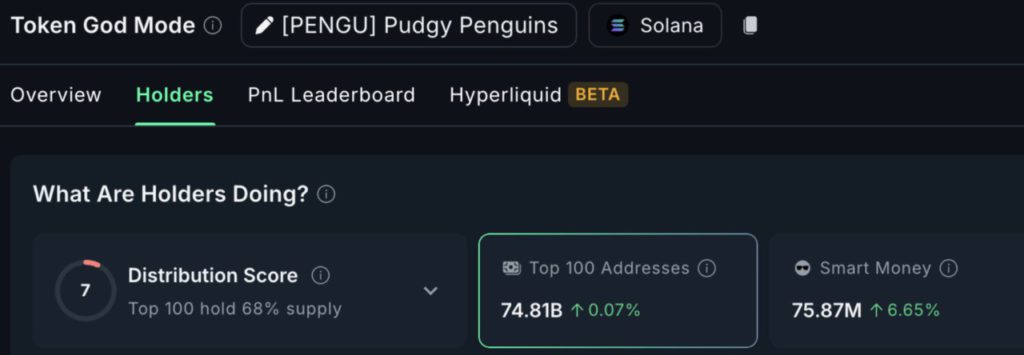
Holdings by smart money jumped 6.65% in just one day, reaching 75.87 million PENGUs. Smart money usually takes positions in advance of short-term price movements, so this inflow is a significant signal – especially ahead of the interest rate cut that is expected to happen in a few days.
It should be noted that smart money is generally looking for quick rebounds and short-term gains, unlike long-term investors.
The strongest signal came from the Relative Strength Index (RSI) indicator. Between July 7 and September 6, the PENGU price formed a higher low, while the RSI made a lower low. This pattern is known as a hidden bullish divergence.
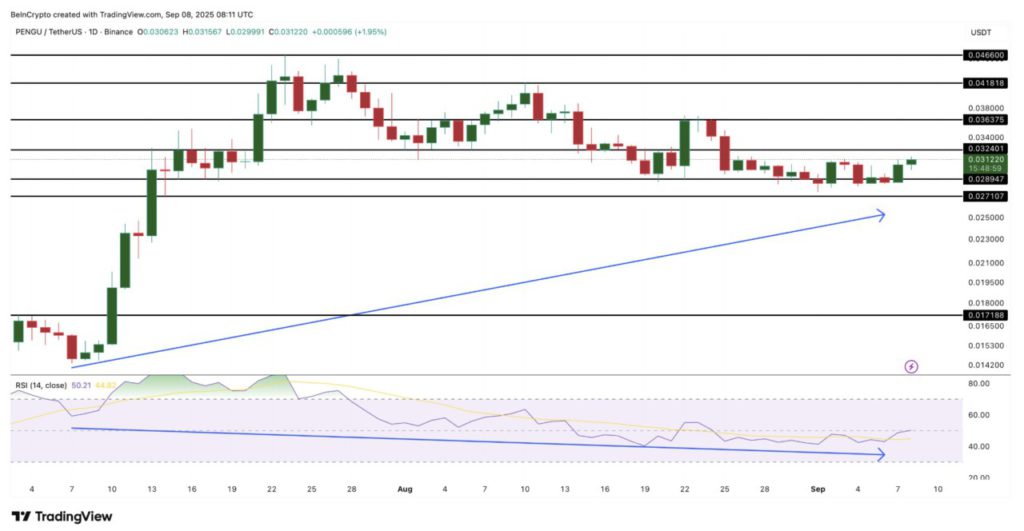
This kind of divergence usually indicates that while short-term momentum appears to be weakening, the larger uptrend is still holding and could potentially continue. For traders, this often signals the beginning of a new rally phase-something that the smart money seems to be anticipating.
Read also: 5 Altcoins That Are Garnering Attention Right Now, Based on Binance Netflow Metrics
If positive momentum is maintained, PENGU resistance is at $0.032, with further targets at $0.036 and $0.041. Conversely, if the price drops below $0.027, this bullish setup could fall and risk pushing the price to $0.017 level.
Cardano (ADA)
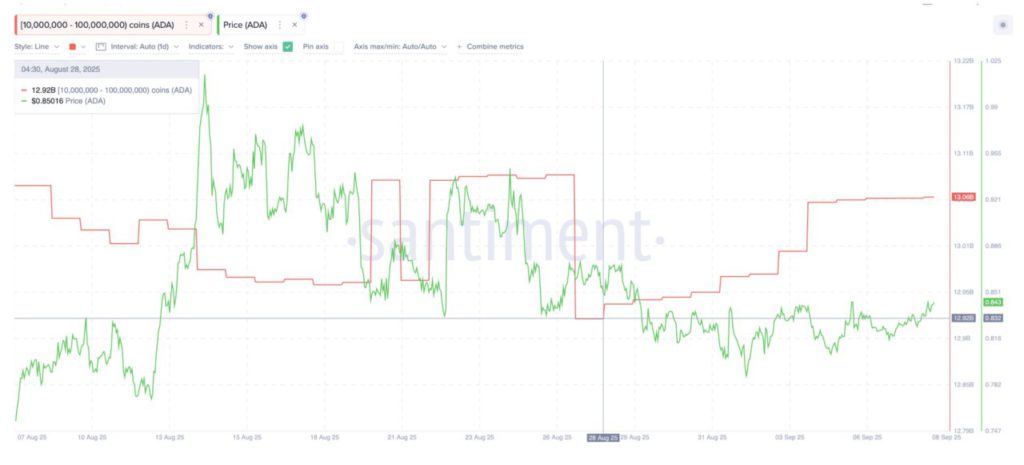
Cardano completes the list of Made in USA coins of interest, with signs of a rebound emerging. In the past week, the ADA price did weaken slightly, but whale activity tells a different story.
The 10 million to 100 million ADA holder group has increased their accumulation from 12.92 billion to 13.06 billion since August 28. That translates to an additional 140 million ADA, worth nearly $117.6 million at the current price of around $0.84.
This large accumulation is in line with the bullish signals on the 4-hour chart. The 20-period Exponential Moving Average (EMA) (red line) has broken above the 50 EMA (orange line), and the price is now trading above all major EMA lines, including the 200 EMA. Traders often refer to this pattern as a golden crossover, which is an early sign of a potential larger rebound.
For the record, the EMA is an indicator that tracks price trends with greater weight on recent movements. A crossover between the short-term EMA and the long-term EMA is often seen as a signal that momentum is starting to reverse to a bullish direction.
Currently, the 20 EMA line is also starting to approach the dark blue line or 200 EMA. If another bullish crossover is formed, the price of ADA has the potential to break the next important levels.
For price levels, ADA’s first resistance is at $0.85. If broken, the next target is at $0.86-$0.87.
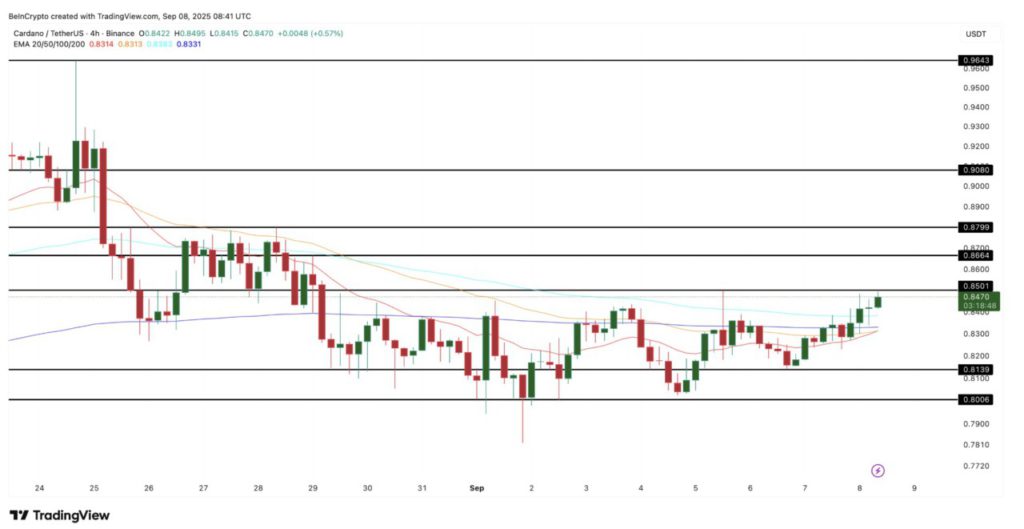
Meanwhile, a sustained breakout above $0.90 could open the way towards $0.96, a level that hasn’t been tested over the past few weeks. Conversely, if the price drops below $0.80, this bullish outlook could weaken.
With whale accumulation and strong technical signals, ADA has the potential to continue its new rally in September.
That’s the latest information about crypto. Follow us on Google News to get the latest crypto news about crypto projects and blockchain technology. Also, learn crypto from scratch with complete discussion through Pintu Academy and stay up-to-date with the latest crypto market such as bitcoin price today, xrp coin price today, dogecoin and other crypto asset prices through Pintu Market.
Enjoy an easy and secure crypto trading experience by downloading Pintu crypto app through Google Play Store or App Store now. Also, get a web trading experience with various advanced trading tools such as pro charting, various types of order types, and portfolio tracker only at Pintu Pro.
*Disclaimer
This content aims to enrich readers’ information. Pintu collects this information from various relevant sources and is not influenced by outside parties. Note that an asset’s past performance does not determine its projected future performance. Crypto trading activities have high risk and volatility, always do your own research and use cold cash before investing. All activities of buying and selling bitcoin and other crypto asset investments are the responsibility of the reader.
Reference:
- BeInCrypto. Made in USA Coins: September Second Week. Accessed on September 10, 2025
Latest News
© 2026 PT Pintu Kemana Saja. All Rights Reserved.
The trading of crypto assets is carried out by PT Pintu Kemana Saja, a licensed and regulated Digital Financial Asset Trader supervised by the Financial Services Authority (OJK), and a member of PT Central Finansial X (CFX) and PT Kliring Komoditi Indonesia (KKI). Crypto asset trading is a high-risk activity. PT Pintu Kemana Saja do not provide any investment and/or crypto asset product recommendations. Users are responsible for thoroughly understanding all aspects related to crypto asset trading (including associated risks) and the use of the application. All decisions related to crypto asset and/or crypto asset futures contract trading are made independently by the user.