Bitcoin Shows 3 Red Flags — Is a Major Plunge Still Ahead?
Jakarta, Pintu News – Bitcoin (BTC) is holding at around $112,100, up about 1% in the past week. The rise from the $107,200 level to $112,100 marks the beginning of September which is a bit of a relief after a decline of more than 6% throughout August. Traders welcomed the rebound, although the big picture is still rather negative.
On a monthly basis, Bitcoin is still down about 9%, and some new signals suggest the bearish pressure is not completely over. The question now is simple: can Bitcoin hold the $112,000 level, or will the trend reverse again?
Long-term Investors Start Reducing Deposits, While Whales Return to Exchanges
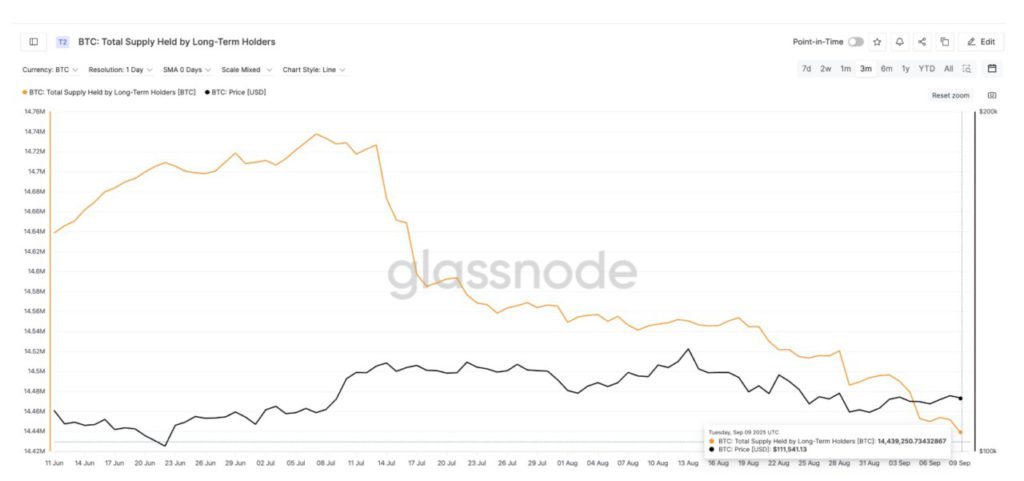
The first warning sign comes from long-term holders. Their wallets are usually full of confidence and they rarely unwind assets when prices are weak. Since mid-July, however, this picture has changed.
Read also: BTC Hits $113K Today, Hinting at a Possible Symmetrical Triangle Breakout
On July 13, there were 14.72 million BTC held by long-term holders. Entering early September, that number dropped to 14.43 million BTC, the lowest level in three months.
This means that around 290,000 BTC has gone out of strong hands – a number that is not small and indicates that even patient investors are now choosing to reduce risk or sell every time the price rebounds.
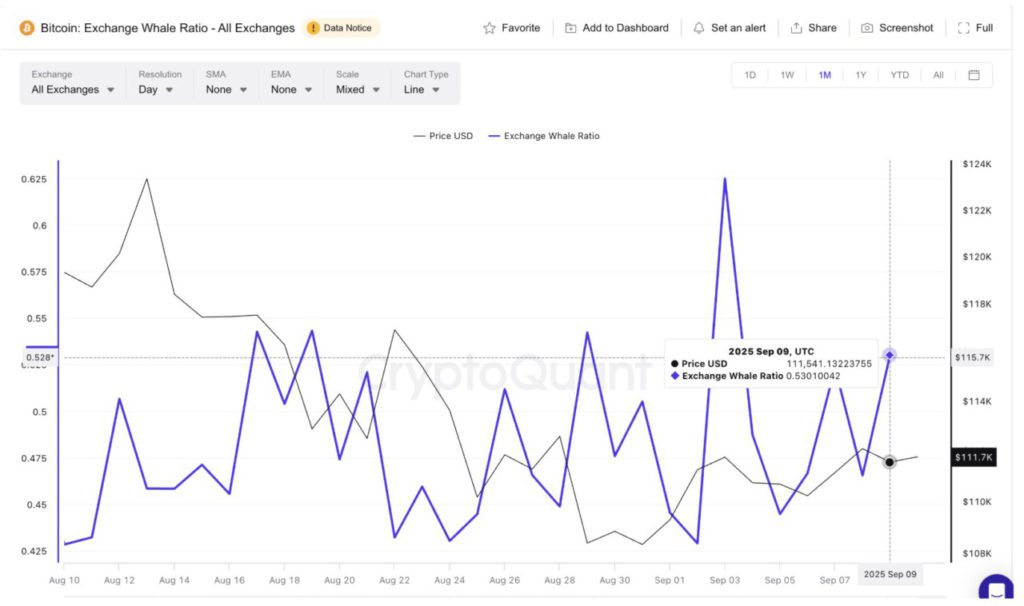
On the other hand, whales are back in the spotlight. The Exchange Whale Ratio – a metric that measures the portion of inflows to exchanges from the 10 largest wallets – rose from 0.44 on September 5 to 0.53 at the time of writing. The last time the ratio reached similar levels, on August 21, Bitcoin price plummeted from $116,900 to $108,300 in just a few days.
The monthly chart of the Exchange Whale Ratio also shows an interesting pattern: in the last 30 days, whales have consistently moved BTC to exchanges, even when the price increase was only slight. The recurring peaks of the local indicator reinforce the validation of this pattern.
Combined, the trend of long-term holders reducing backlogs and whales continuing to push supply to the exchanges is definitely not a bullish signal. Rather, it suggests that supply is being prepared in case prices weaken again.
Bearish Divergence on Bitcoin Price Chart Strengthens Downward Pressure Signal
The on-chain data is in line with Bitcoin’s price chart movements. Between August 28 and September 8, Bitcoin price formed lower highs, while the Relative Strength Index (RSI) – a buying momentum indicator – printed higher highs. This discrepancy is known as a hidden bearish divergence.
Read also: Ethereum Hits $4,300 — Is $5,000 the Next Target?
In other words, the momentum appears to be strong, but the price action doesn’t follow suit. Patterns like this are often the first sign of a continued decline.
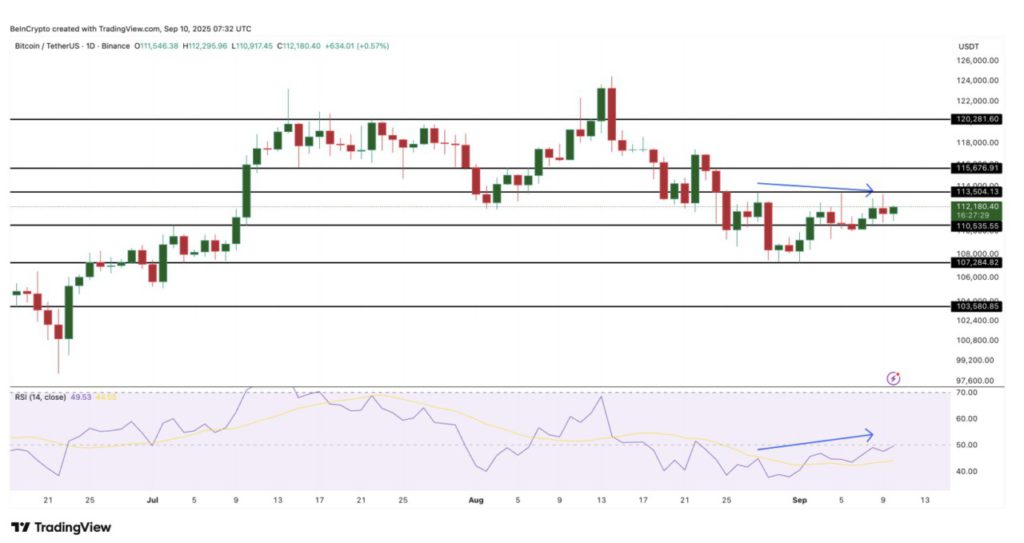
For traders, such formations usually warn of a potential continuation of the bearish trend, which could extend Bitcoin’s monthly decline – recorded at nearly -9% in that period.
If this level is broken due to selling pressure and bearish divergence, the door to $107,200 will open, and it could even continue to $103,500 if the pressure gets stronger.
Conversely, if the price is able to close above $113,500, then the bearish signal from the RSI will be canceled out, and control could return to the bulls.
That’s the latest information about crypto. Follow us on Google News to get the latest crypto news about crypto projects and blockchain technology. Also, learn crypto from scratch with complete discussion through Pintu Academy and stay up-to-date with the latest crypto market such as bitcoin price today, xrp coin price today, dogecoin and other crypto asset prices through Pintu Market.
Enjoy an easy and secure crypto trading experience by downloading Pintu crypto app via Google Play Store or App Store now. Also, get a web trading experience with various advanced trading tools such as pro charting, various types of order types, and portfolio tracker only at Pintu Pro.
*Disclaimer
This content aims to enrich readers’ information. Pintu collects this information from various relevant sources and is not influenced by outside parties. Note that an asset’s past performance does not determine its projected future performance. Trading crypto carries high risk and volatility, always do your own research and use cold hard cash before investing. All activities of buying and selling bitcoin and other crypto asset investments are the responsibility of the reader.
Reference:
- BeInCrypto.
Latest News
© 2026 PT Pintu Kemana Saja. All Rights Reserved.
The trading of crypto assets is carried out by PT Pintu Kemana Saja, a licensed and regulated Digital Financial Asset Trader supervised by the Financial Services Authority (OJK), and a member of PT Central Finansial X (CFX) and PT Kliring Komoditi Indonesia (KKI). Crypto asset trading is a high-risk activity. PT Pintu Kemana Saja do not provide any investment and/or crypto asset product recommendations. Users are responsible for thoroughly understanding all aspects related to crypto asset trading (including associated risks) and the use of the application. All decisions related to crypto asset and/or crypto asset futures contract trading are made independently by the user.