Bitcoin Price Surges to $116,000 Today — Is the Bullish Flag Pointing to $122,000 Next?
Jakarta, Pintu News – As of September 16, Bitcoin (BTC) price was briefly trading at around $115,700 after experiencing a steady rise of 3.2% in the past seven days. An important bullish pattern has just appeared on the chart, signaling further upside potential.
However, this movement may not be smooth – there are still obstacles that could slow down the rate of increase. So, how is the current Bitcoin price moving?
Bitcoin Price Rises 1.55% in 24 Hours
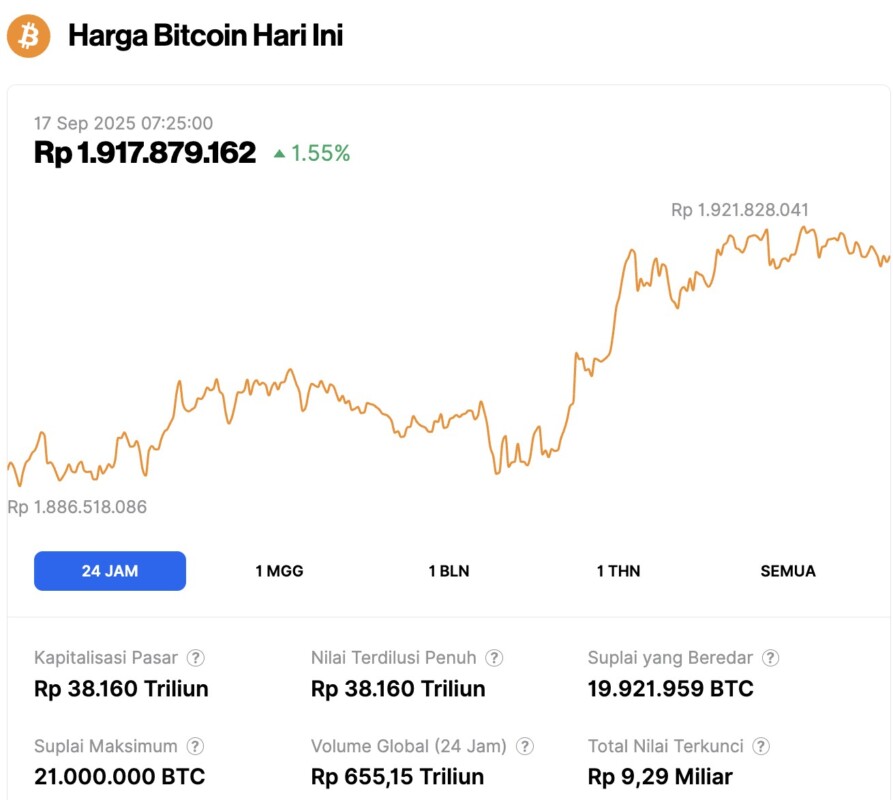
On September 17, 2025, Bitcoin was trading at $116,764, equivalent to IDR 1,917,879,162, marking a 1.55% increase over the past 24 hours. During this period, BTC hit a low of IDR 1,886,518,086 and a high of IDR 1,921,828,041.
At the time of writing, Bitcoin’s market capitalization is approximately IDR 38,160 trillion, while its 24-hour trading volume has declined by 12%, now sitting at around IDR 655.15 trillion.
Read also: Ethereum Price Dips as Crypto Whales Shift Over $20 Million in ETH
Exchange Outflows Increase, but One Group Surprises
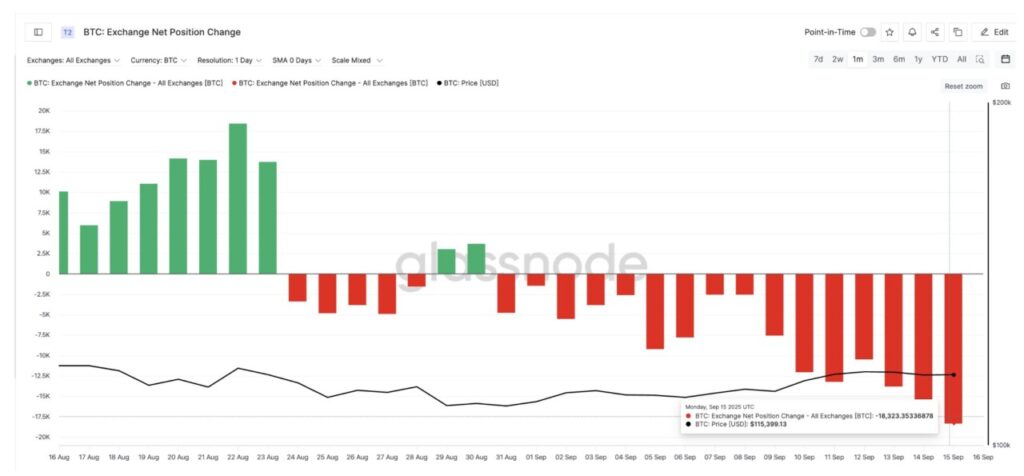
On-chain data shows strong accumulation in line with the recent upward price trend. Net position change on exchanges – which tracks the inflow and outflow of Bitcoin from trading platforms – showed sharply negative numbers over the past week.
Its value dropped from -2,531 BTC on September 8 to -18,323 BTC on September 15, reflecting an outflow surge of over 620%. This negative number signifies that more Bitcoin is being pulled out of exchanges, which is often interpreted as moving assets into long-term storage, rather than for sale in the near future.
What makes this situation unusual is the involvement of long-term holders. Hodler’s net position change measurement method – which tracks the supply of Bitcoin held by long-term investors – went from -8,652 BTC to +591 BTC between September 14 and 15, just as a bullish price pattern started to form.
This change in direction is very important because long-term holders are usually already in a profit position at this price level and are likely to sell.
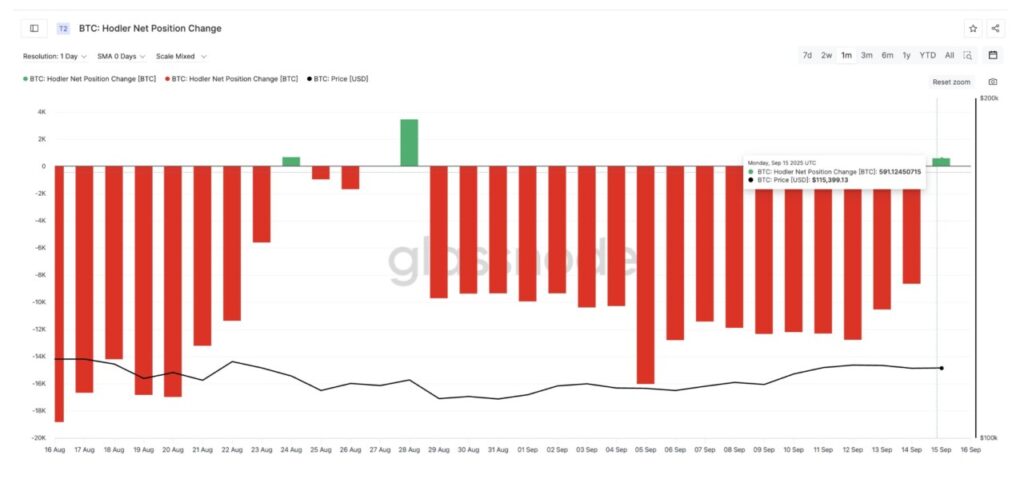
However, their decision to add to their holdings instead of selling reflects a strong belief in the potential breakout to occur, and this reinforces the overall trend of outflows from the bourse.
These two indicators together point to a stronger level of market confidence than mere buying by retail investors. And this level of confidence, which comes ahead of a potential interest rate cut by the Fed, does not appear to be a coincidence.
Bull Flag Pattern in Bitcoin Price Hints at a Breakout – But Not Without Obstacles
The current chart pattern is a bull flag, a classic trend continuation signal. Recently, Bitcoin touched the $115,900 level on the 12-hour chart (16/9), opening the opportunity for a breakout, before correcting back to $115,700 as of September 16.
Read also: Are the First Dogecoin and XRP ETFs in the US Launching This Week? Here’s What You Need to Know!
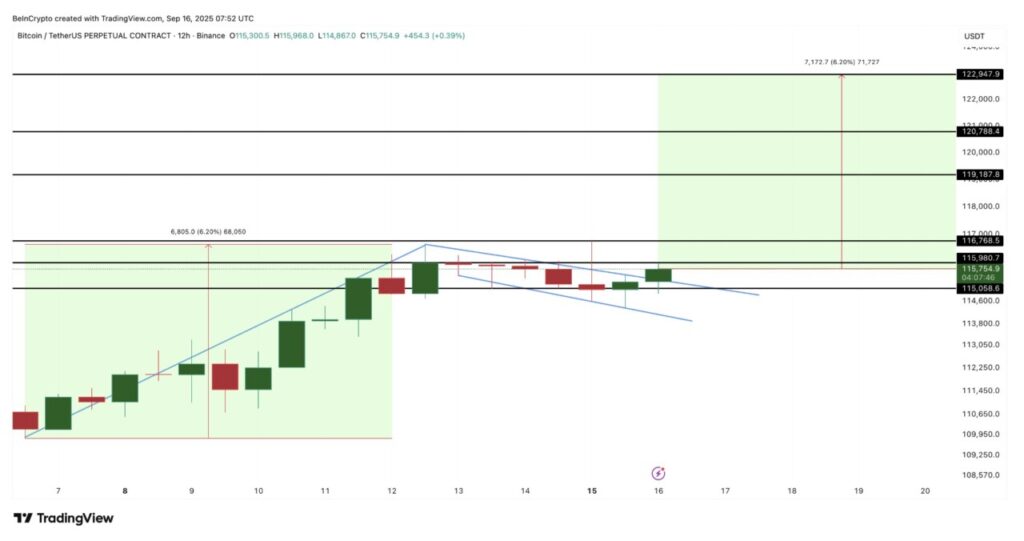
If the breakout is confirmed with a strong close above the upper trendline of the flag pattern (which is currently holding), then the measured target move could be over $122,000. Interim resistance levels to watch are at $116,700 and $120,700.
However, the road to this breakout was not entirely smooth. The on-chain cost basis heatmap shows a large supply wall between $115,900 and $120,700, where approximately 714,302 BTC previously changed hands.
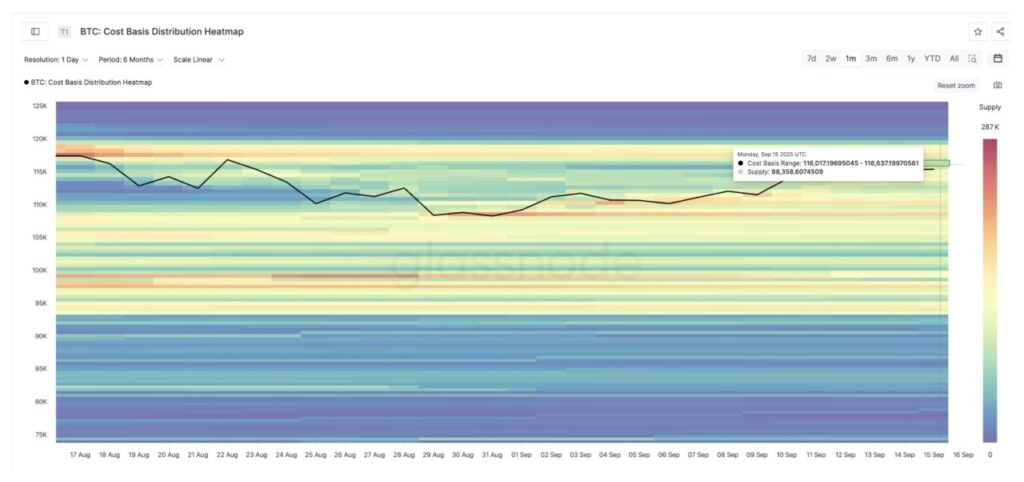
These areas of concentration are often zones of resistance, as holders who bought at higher prices may try to sell to make a return.
The invalidation level is at $115,000 – if the selling pressure pushes Bitcoin price down below this point, then the bull flag pattern loses its momentum and the bullish scenario will temporarily weaken.
But as long as the price is able to break and hold above $115,900, the bulls remain in control, and a target of $122,900 is still possible – provided the huge supply wall can be absorbed by the market.
That’s the latest information about crypto. Follow us on Google News to get the latest crypto news about crypto projects and blockchain technology. Also, learn crypto from scratch with complete discussion through Pintu Academy and stay up-to-date with the latest crypto market such as bitcoin price today, xrp coin price today, dogecoin and other crypto asset prices through Pintu Market.
Enjoy an easy and secure crypto trading experience by downloading Pintu crypto app via Google Play Store or App Store now. Also, get a web trading experience with various advanced trading tools such as pro charting, various types of order types, and portfolio tracker only at Pintu Pro.
*Disclaimer
This content aims to enrich readers’ information. Pintu collects this information from various relevant sources and is not influenced by outside parties. Note that an asset’s past performance does not determine its projected future performance. Crypto trading activities have high risk and volatility, always do your own research and use cold cash before investing. All activities of buying and selling bitcoin and other crypto asset investments are the responsibility of the reader.
Reference:
- BeInCrypto. Bitcoin “Flag” Flies High as Price Eyes $122,000 – But There’s a Catch. Accessed on September 17, 2025
Latest News
© 2026 PT Pintu Kemana Saja. All Rights Reserved.
The trading of crypto assets is carried out by PT Pintu Kemana Saja, a licensed and regulated Digital Financial Asset Trader supervised by the Financial Services Authority (OJK), and a member of PT Central Finansial X (CFX) and PT Kliring Komoditi Indonesia (KKI). Crypto asset trading is a high-risk activity. PT Pintu Kemana Saja do not provide any investment and/or crypto asset product recommendations. Users are responsible for thoroughly understanding all aspects related to crypto asset trading (including associated risks) and the use of the application. All decisions related to crypto asset and/or crypto asset futures contract trading are made independently by the user.