Solana Price Poised to Rebound at $224 as Bullish Pattern Signals a New All-Time High
Jakarta, Pintu News – Reporting from BeInCrypto, the recent decline in the price of Solana (SOL) does not seem as bad as it looks. Despite experiencing a daily decline of 0.6%, Solana ‘ s chart structure and on-chain data suggest that this phase may only be a temporary pause before resuming the next big rise.
At around $234, Solana still recorded a gain of almost 12% in the past week and 16% in a month, signaling that the momentum has not been lost – it has just slowed down for a moment.
Short-term selling pressure seems to be starting to meet consistent accumulation action, so the $224 area is potentially the bottom point of the current correction before Solana resumes its uptrend towards new record highs.
Short-Term Selling Pressure Meets Accumulation from Loyal Holders
Some market participants started to take profit. Solana’s exchange net position change data – which measures the difference between the number of coins entering and leaving a centralized exchange – changed from -2.01 million SOL on October 3 to +1.82 million SOL on October 5.
Read also: 2 Altcoins Gaining Attention Ahead of the Fed’s Policy Decision at FOMC Meeting
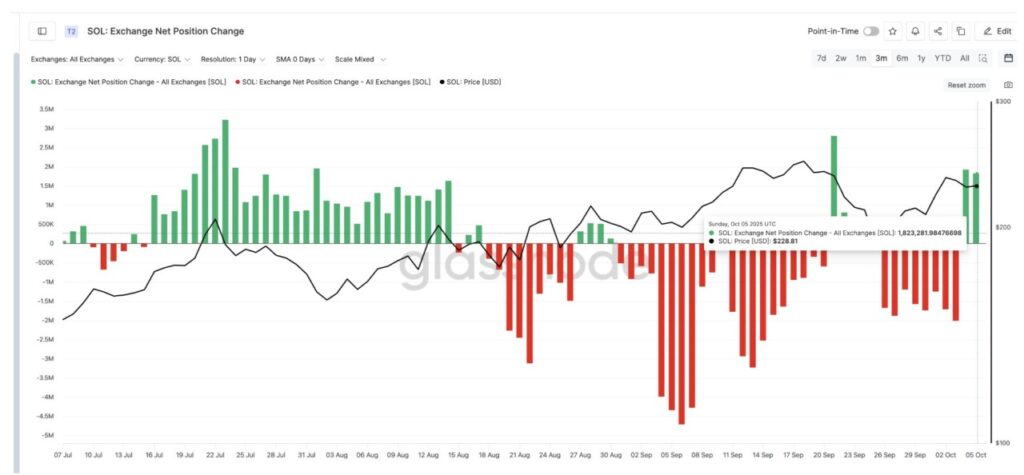
A positive number indicates that more tokens are being sent to exchanges, usually signaling that traders are preparing to sell.
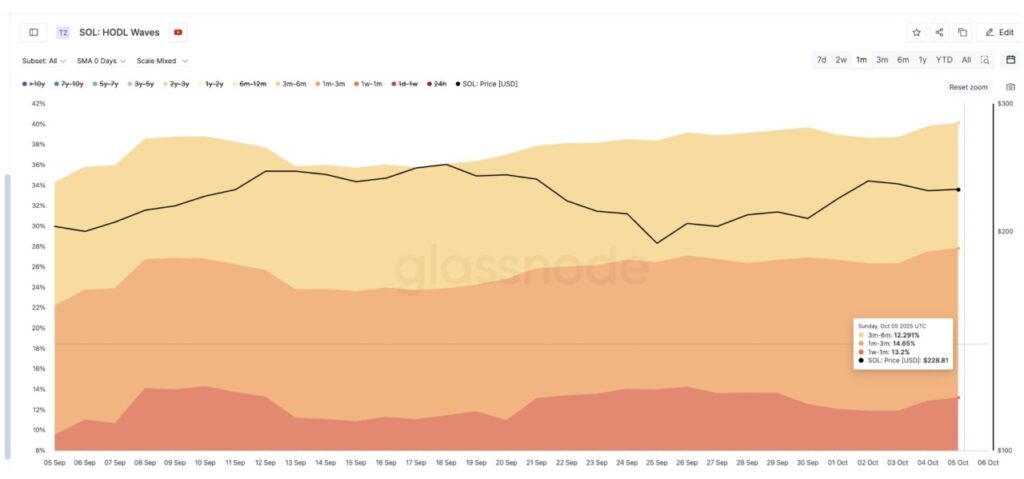
However, this selling pressure was offset by the confidence of medium-term holders. Based on Glassnode’s HODL Waves data, which tracks how long a coin remains unmovable, there is an increase in accumulation from short- to medium-term holders:
- 1 week – 1 month holders: up from 9.55% to 13.2% of total supply
- 1 – 3 month holder: up from 12.6% to 14.65%
- 3 – 6 month holder: up from 11.82% to 12.29%
In simple terms, while some Solana traders chose to secure profits, small and medium-sized wallets quietly continued to add to their holdings.
This combination of selling and buying often signals a healthy correction, not the beginning of a trend reversal. To find out where the floor of the correction is now, check out the discussion in the next section.
Solana Price Breakout Pattern Eyes $279 and Higher
On the daily chart (October 6), the price of Solana (SOL) is moving in an ascending channel pattern, which is characterized by the gradual formation of higher highs and higher lows. Within this channel, there is an important price level around $224, which several times proved to be a holding area when the price corrected.
Read also: Crypto Whale Moves $55 Million in XRP to Ripple — Is a Major Sell-Off Coming?
If the next price drop comes with more pressure, this area is likely to be a bounce back point, as despite the selling pressure on the bourse, some investor groups continue to add to their SOL holdings.
Meanwhile, the Relative Strength Index (RSI) indicator showed a hidden bullish divergence. Between August and the end of September, the Solana price formed a higher low, while the RSI formed a lower low. This pattern usually signals that the uptrend still has hidden strength behind the price movement.
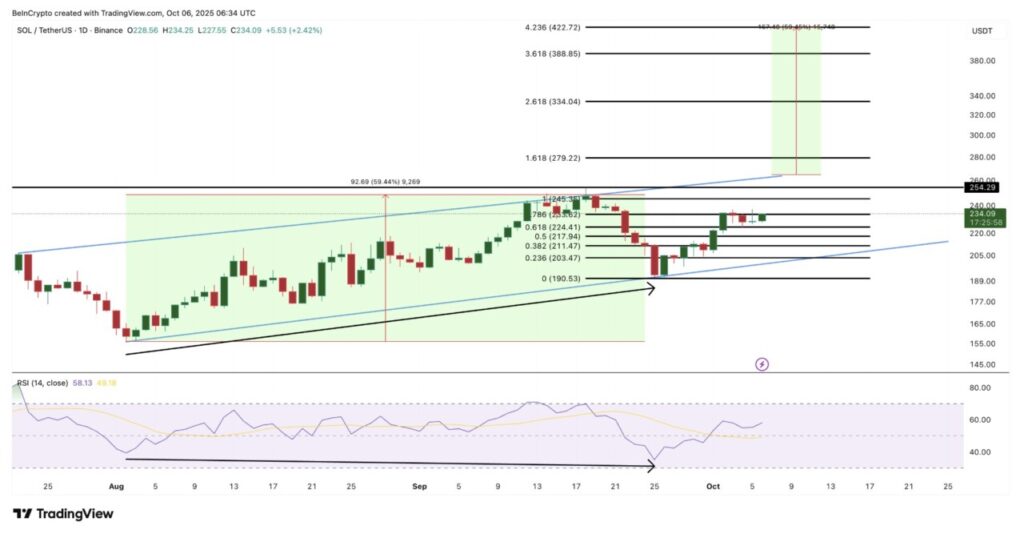
If Solana manages to close the daily candle above $245, the opportunity to break the next resistance at $279 will be wide open. Based on the height of the channel, the potential breakout target of the upper trend line of this channel is around $422 – which could be the top of a new cycle if the bullish momentum persists.
For now, the correction seems more like a “breather” before the next rise, rather than a sign of weakness. However, if the price drops below $190, then this temporary bullish view will be considered invalid.
That’s the latest information about crypto. Follow us on Google News to get the latest crypto news about crypto projects and blockchain technology. Also, learn crypto from scratch with complete discussion through Pintu Academy and stay up-to-date with the latest crypto market such as bitcoin price today, xrp coin price today, dogecoin and other crypto asset prices through Pintu Market.
Enjoy an easy and secure crypto trading experience by downloading Pintu crypto app via Google Play Store or App Store now. Also, get a web trading experience with various advanced trading tools such as pro charting, various types of order types, and portfolio tracker only at Pintu Pro.
*Disclaimer
This content aims to enrich readers’ information. Pintu collects this information from various relevant sources and is not influenced by outside parties. Note that an asset’s past performance does not determine its projected future performance. Crypto trading activities have high risk and volatility, always do your own research and use cold cash before investing. All activities of buying and selling bitcoin and other crypto asset investments are the responsibility of the reader.
Reference:
- BeInCrypto. Solana Price Pullback After New All-Time High. Accessed on October 7, 2025
Latest News
© 2026 PT Pintu Kemana Saja. All Rights Reserved.
The trading of crypto assets is carried out by PT Pintu Kemana Saja, a licensed and regulated Digital Financial Asset Trader supervised by the Financial Services Authority (OJK), and a member of PT Central Finansial X (CFX) and PT Kliring Komoditi Indonesia (KKI). Crypto asset trading is a high-risk activity. PT Pintu Kemana Saja do not provide any investment and/or crypto asset product recommendations. Users are responsible for thoroughly understanding all aspects related to crypto asset trading (including associated risks) and the use of the application. All decisions related to crypto asset and/or crypto asset futures contract trading are made independently by the user.