Bitcoin Falls to $121,000 — Can BTC Rebound to $130,000 Next?
Jakarta, Pintu News – Bitcoin (BTC) started October with a steady rise. In the past week, it gained almost 9% and is still holding strong above the $124,000 level, despite a slight correction from its recent record highs.
Bitcoin’s price movement this time was driven not only by market momentum, but also by profound changes in on-chain activity that showed strong conviction from both long-term and short-term holders.
One number that stands out is $130,000 – the next big target indicated by chart patterns and market data. So, how is the current Bitcoin price moving?
Bitcoin Price Drops 1.24% in 24 Hours
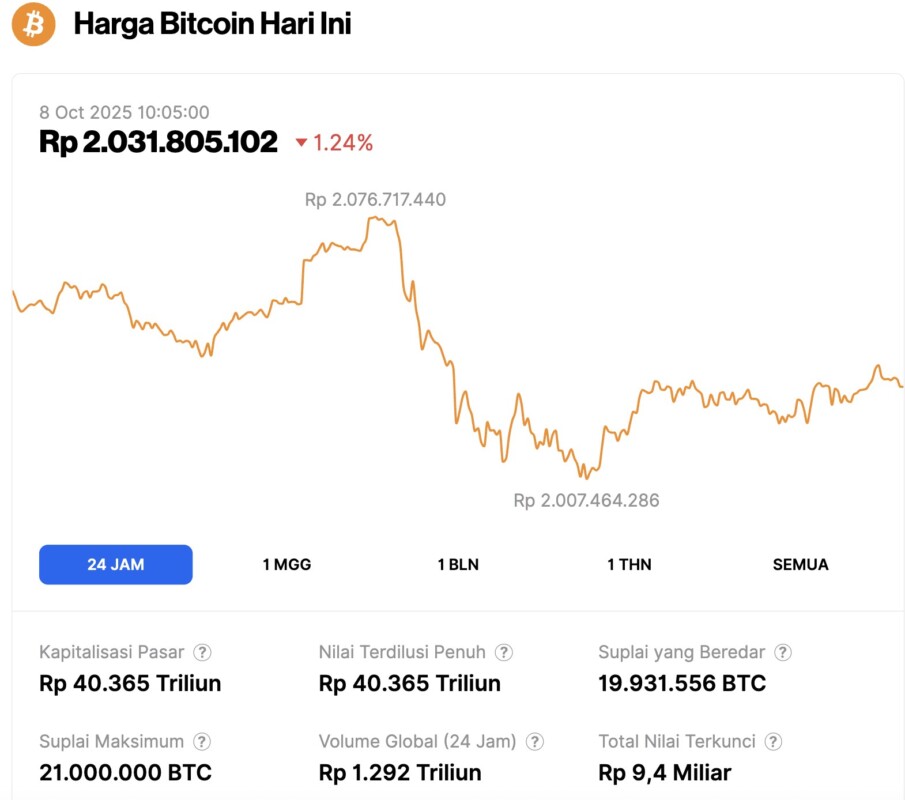
As of October 8, 2025, Bitcoin is trading at $121,869, or roughly IDR 2.03 billion, marking a 1.24% decline over the past 24 hours. During this period, BTC reached a daily low of IDR 2.01 billion and a high of IDR 2.08 billion.
At the time of writing, Bitcoin’s market capitalization stands at approximately IDR 40,365 trillion, while 24-hour trading volume has increased by 16%, reaching around IDR 1,292 trillion.
Read also: Gold Price Nears $4,000 — What Could This Mean for Bitcoin’s Next Move?
Net Outflows Touch Low, Signaling Holder Accumulation Action
One of the clearest signs of increased market confidence is seen in Bitcoin’s exchange net flow – a metric that measures the difference between the amount of BTC coming in and out of centralized exchanges.
A negative value signifies that more Bitcoin is being withdrawn than deposited, indicating that holders prefer to hold rather than sell their assets.
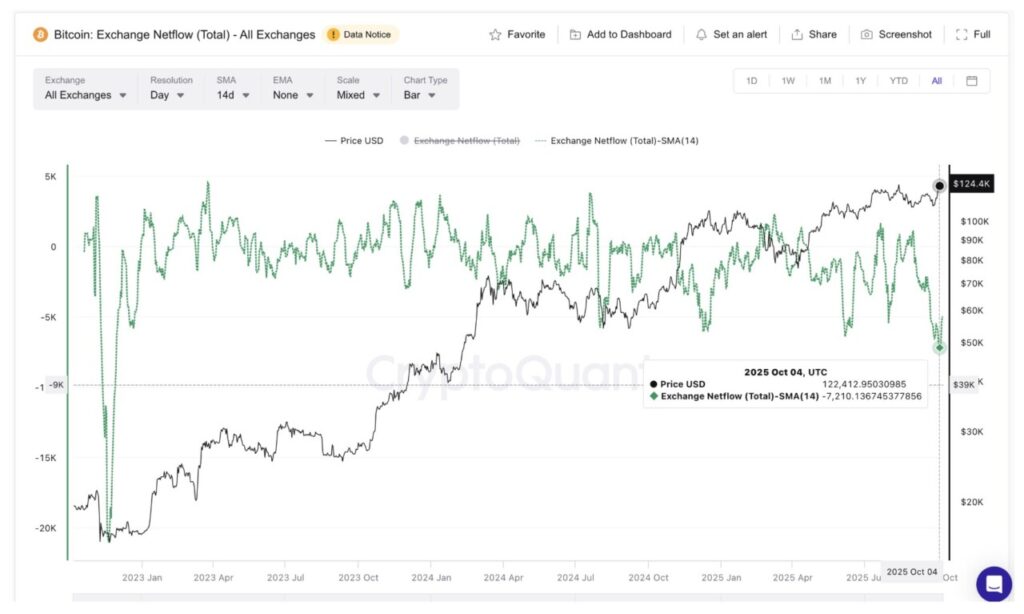
As of October 4, the 14-day Simple Moving Average (SMA) for Bitcoin net flows stood at -7,210 BTC, the lowest level in almost three years. The last time outflows of this magnitude occurred was in November 2022 – just before Bitcoin’s price jumped dramatically from around $16,000 to over $72,000 in the following months.
This makes the current situation even more interesting, as it indicates that the market is slowly shifting towards the accumulation phase, rather than distribution.
As confirmation, the HODL Waves data shows how long the coin remains unmoving. In the past month, both short-term and long-term holders have increased their holdings.
The 1-3 month holder group increased from 8.75% to 9.59% of the total supply, while the 2-3 year holder group rose from 7.00% to 7.13%.
The 0.13% increase may seem small, but it actually represents tens of thousands of BTC, a significant change when compared to the total supply of Bitcoin – as well as a strong signal of renewed confidence from long-term holders.
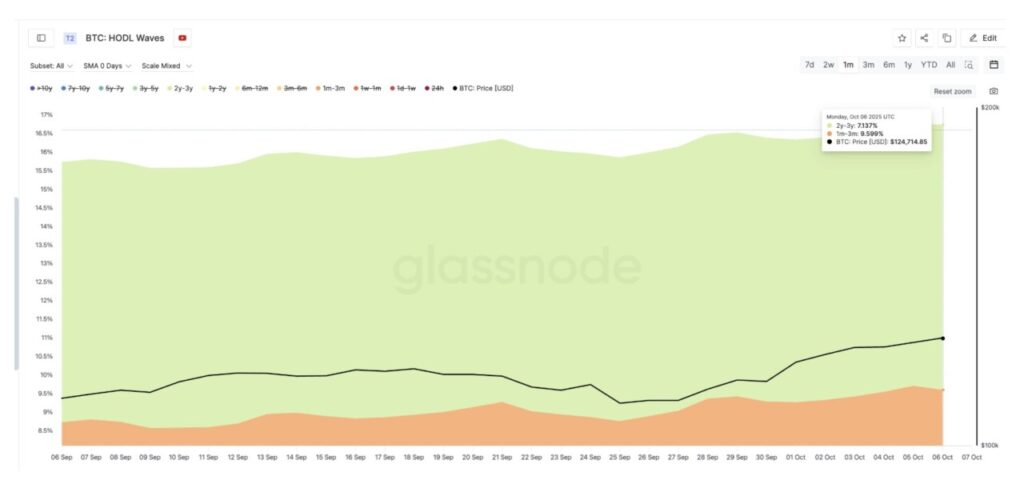
This dual participation is important: if only one party (either short- or long-term) were accumulating, the price rally could be considered fragile. But since both are showing the same conviction, it creates a stronger foundation for a potential sustained price rise.
Read also: Will $6 Billion Real Estate Giant Opendoor Start Accepting Bitcoin Payments Soon?
Breakout Pattern Leads BTC Target to $130,100
On the daily chart (7/10), Bitcoin price has just confirmed an inverse head-and-shoulders breakout pattern with a solid close above theneckline at $122,100.
Based on this pattern, the short-term upside target is towards the area above $130,000, as long as the buying momentum is maintained.
The Wyckoff Volume indicator provides additional context. It tracks the dominance between buyers (marked by blue bars) and sellers (orange bars) in a trading session. During the correction in September, the shift from blue to orange bars marked the price drop from $117,900 to $108,400.
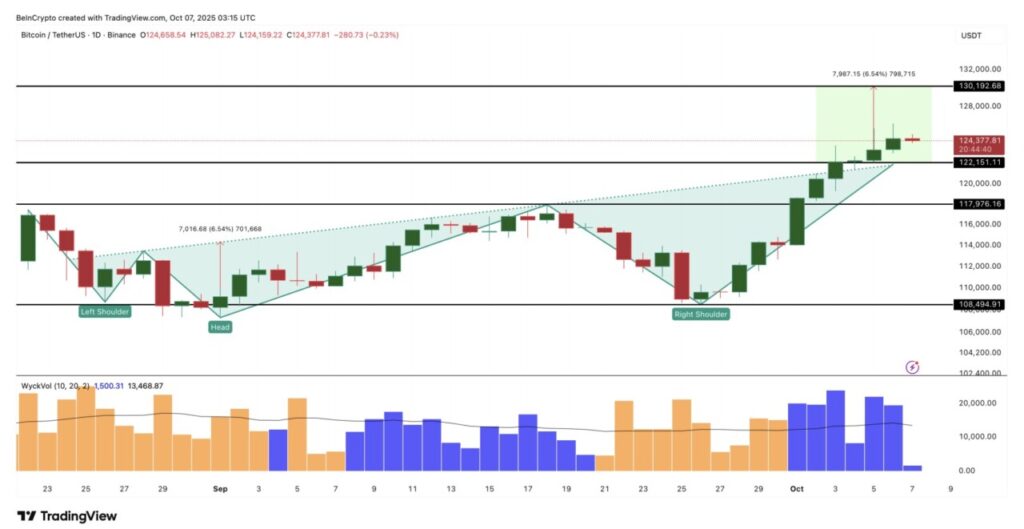
But this time the shift hasn’t happened – blue bars still dominate, signaling that buying demand remains strong.
If the Bitcoin price is able to stay above the $122,100 level, the opportunity to reach $130,100 is very open. In fact, if it manages to break that level, the market has the potential to print a new cycle high this quarter.
Even so, a drop below $117,900 or $108,400 could temporarily invalidate this bullish pattern. However, the on-chain data so far still shows the market’s tendency remains skewed towards the positive.
That’s the latest information about crypto. Follow us on Google News to get the latest crypto news about crypto projects and blockchain technology. Also, learn crypto from scratch with complete discussion through Pintu Academy and stay up-to-date with the latest crypto market such as bitcoin price today, xrp coin price today, dogecoin and other crypto asset prices through Pintu Market.
Enjoy an easy and secure crypto trading experience by downloading Pintu crypto app via Google Play Store or App Store now. Also, get a web trading experience with various advanced trading tools such as pro charting, various types of order types, and portfolio tracker only at Pintu Pro.
*Disclaimer
This content aims to enrich readers’ information. Pintu collects this information from various relevant sources and is not influenced by outside parties. Note that an asset’s past performance does not determine its projected future performance. Crypto trading activities have high risk and volatility, always do your own research and use cold cash before investing. All activities of buying and selling bitcoin and other crypto asset investments are the responsibility of the reader.
Reference:
- BeInCrypto. Bitcoin Exchange Flows Hit Multi-Year Lows -Is $130,000 Next? Accessed on October 8, 2025
Latest News
© 2026 PT Pintu Kemana Saja. All Rights Reserved.
The trading of crypto assets is carried out by PT Pintu Kemana Saja, a licensed and regulated Digital Financial Asset Trader supervised by the Financial Services Authority (OJK), and a member of PT Central Finansial X (CFX) and PT Kliring Komoditi Indonesia (KKI). Crypto asset trading is a high-risk activity. PT Pintu Kemana Saja do not provide any investment and/or crypto asset product recommendations. Users are responsible for thoroughly understanding all aspects related to crypto asset trading (including associated risks) and the use of the application. All decisions related to crypto asset and/or crypto asset futures contract trading are made independently by the user.