Ethereum Price Falls to $4,400 (Oct 9): Despite the Dip, Optimism for ETH Remains High
Jakarta, Pintu News – Ethereum (ETH) has rallied again after retesting the area of its highest price record, and the current price movement shows that the potential for an increase towards new levels is still wide open.
On October 3, Ethereum reached a new record high of $4,955, and based on recent analysis, the upward trend is expected to continue despite a temporary correction. Here is a price chart to identify potential levels that could be the peak of this upward movement, according to CCN.
Before discussing further, how is Ethereum’s current price movement?
Ethereum Price Drops 1.66% in 24 Hours

As of October 9, 2025, Ethereum (ETH) is trading at around $4,411, equivalent to IDR 73,261,866, marking a 1.66% decline over the past 24 hours. During this time, ETH reached an intraday low of IDR 73,299,373 and a high of IDR 75,739,267.
At the time of writing, Ethereum’s market capitalization stands at approximately IDR 8,822 trillion, while its 24-hour trading volume has fallen by 27% to around IDR 612.7 trillion.
Read also: Can the Cardano ETF Hype Spark a Major Rally for ADA? Here’s What the Analysis Reveals
Ethereum Corrects After Reaching Record Highs
Analysis of Ethereum’s weekly chart shows that the price formed a bullish engulfing candlestick last week, having previously bounced strongly from the horizontal support area around $3,900.
Ethereum managed to withstand the downward pressure with a significant bounce, forming a long lower wick and resuming its upward trend over the past two weeks.
That price area has been a major resistance zone since mid-2021, except for the previous record high (black circle) which was only a temporary deviation. After three failed attempts to break through the level (red icon), ETH finally broke through and confirmed the area as new support.
Breakout and retest patterns like this are common in bullish trends, and are usually the start of a big rally – something that was also seen in Ethereum’s recent move.
Last week, a bullish engulfing candlestick formed on the weekly chart, which could be an early signal of a potential sharp rally. As such, the current price action suggests a breakout and retest which usually confirms a long-term trend change.

In terms of momentum indicators, conditions are still very positive. Both the Relative Strength Index (RSI) and Moving Average Convergence Divergence (MACD) are showing a consistent rise with no sign of bearish divergence.
Therefore, Ethereum’s long-term outlook remains bullish as long as the price holds above the $3,950 horizontal support area.
Why is Ethereum Price Rising?
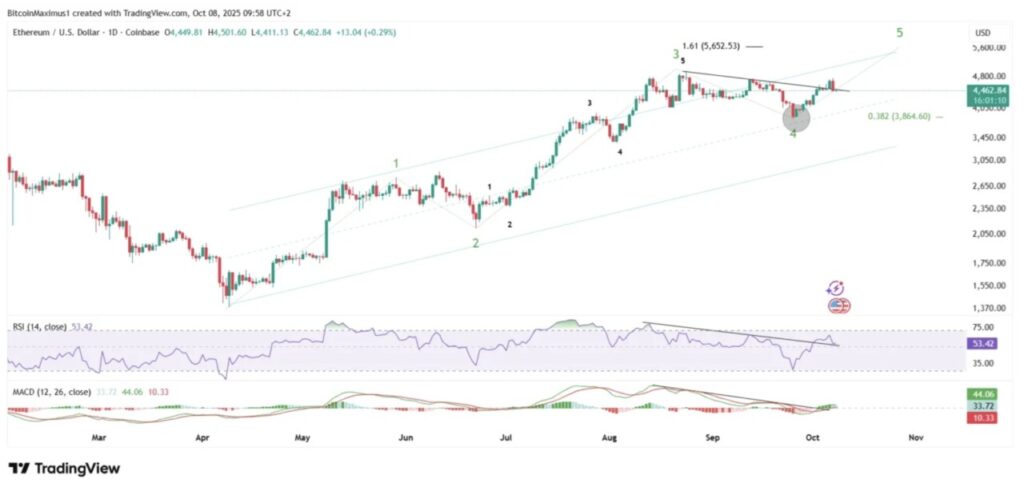
Ethereum’swave count supports the bullish predictions seen on the weekly chart.
Based on the wave analysis, Ethereum is now in the fifth and final wave of its upward phase, which began in April 2025.
Previously, Ethereum had ideally completed the fourth wave correction (black circle) at the 0.382 Fibonacci retracement support level, coinciding with the lower limit of the previous price channel.
Read also: Shiba Inu Gains Momentum: Will Rising New Addresses Help Recover September’s Losses?
After that, Ethereum managed to break the diagonal resistance trend line that had held for almost two months. This breakout was followed by an acceleration in the rate of price increase, signaling that the fifth wave is underway.
In addition, the RSI and MACD indicators have also broken their respective resistance levels, reinforcing the signal that the potential for a new all-time high is growing.
The first target for the fifth wave top is estimated to be around $5,652, based on the 1.61 Fibonacci extension of the last previous decline.
Ethereum vs Bitcoin
The Ethereum to Bitcoin (ETH/BTC) chart shows a very similar pattern to the ETH to USD chart, reinforcing the view that Ethereum is currently in the fifth and final wave of its upward phase.
Ethereum started its fifth wave on September 25, but has yet to break the diagonal resistance trendline-an important confirmation that the fifth wave is indeed underway.
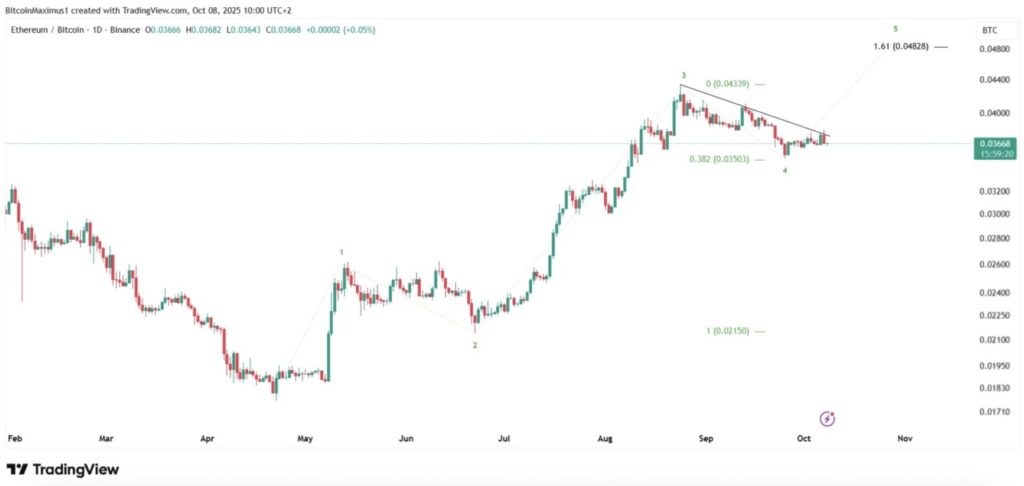
Just like on the ETH/USD chart, the fifth wave started after the price touched the 0.382 Fibonacci retracement support level at ₿0.035. If this calculation is accurate, the fifth wave could potentially end at the 1.61 Fibonacci extension at levels around ₿0.048.
Ethereum’s New Record High
Citing a CCN report, in the long term, Ethereum projections remain bullish as long as the price does not close the candle below $3,950. Wave analysis forecasts one additional upside phase that could push Ethereum price beyond $5,600.
Moreover, ETH also still has room to print a new peak against Bitcoin, which could potentially be the last phase of the current altcoin season.
That’s the latest information about crypto. Follow us on Google News to get the latest crypto news about crypto projects and blockchain technology. Also, learn crypto from scratch with complete discussion through Pintu Academy and stay up-to-date with the latest crypto market such as bitcoin price today, xrp coin price today, dogecoin and other crypto asset prices through Pintu Market.
Enjoy an easy and secure crypto trading experience by downloading Pintu crypto app via Google Play Store or App Store now. Also, get a web trading experience with various advanced trading tools such as pro charting, various types of order types, and portfolio tracker only at Pintu Pro.
*Disclaimer
This content aims to enrich readers’ information. Pintu collects this information from various relevant sources and is not influenced by outside parties. Note that an asset’s past performance does not determine its projected future performance. Crypto trading activities have high risk and volatility, always do your own research and use cold cash before investing. All activities of buying and selling bitcoin and other crypto asset investments are the responsibility of the reader.
Reference:
- CCN. Ethereum (ETH) Price Struggles but Optimism Growing for the Rest of 2025. Accessed on October 9, 2025
Latest News
© 2026 PT Pintu Kemana Saja. All Rights Reserved.
The trading of crypto assets is carried out by PT Pintu Kemana Saja, a licensed and regulated Digital Financial Asset Trader supervised by the Financial Services Authority (OJK), and a member of PT Central Finansial X (CFX) and PT Kliring Komoditi Indonesia (KKI). Crypto asset trading is a high-risk activity. PT Pintu Kemana Saja do not provide any investment and/or crypto asset product recommendations. Users are responsible for thoroughly understanding all aspects related to crypto asset trading (including associated risks) and the use of the application. All decisions related to crypto asset and/or crypto asset futures contract trading are made independently by the user.