Ethereum Price Drops to $3,900 Today as Bullish Divergence Forms Amid Exchange Outflows
Jakarta, Pintu News – The price of Ethereum (ETH) is showing rare technical signals that last appeared six months ago – just before its price surged more than 80%. Currently, the token is down 8.7% in a week, and almost 10% in the last 30 days, which shows a clear downward trend.
However, recent on-chain data and familiar momentum patterns indicate that this decline may be starting to weaken.
Ethereum Price Drops 2.33% in 24 Hours
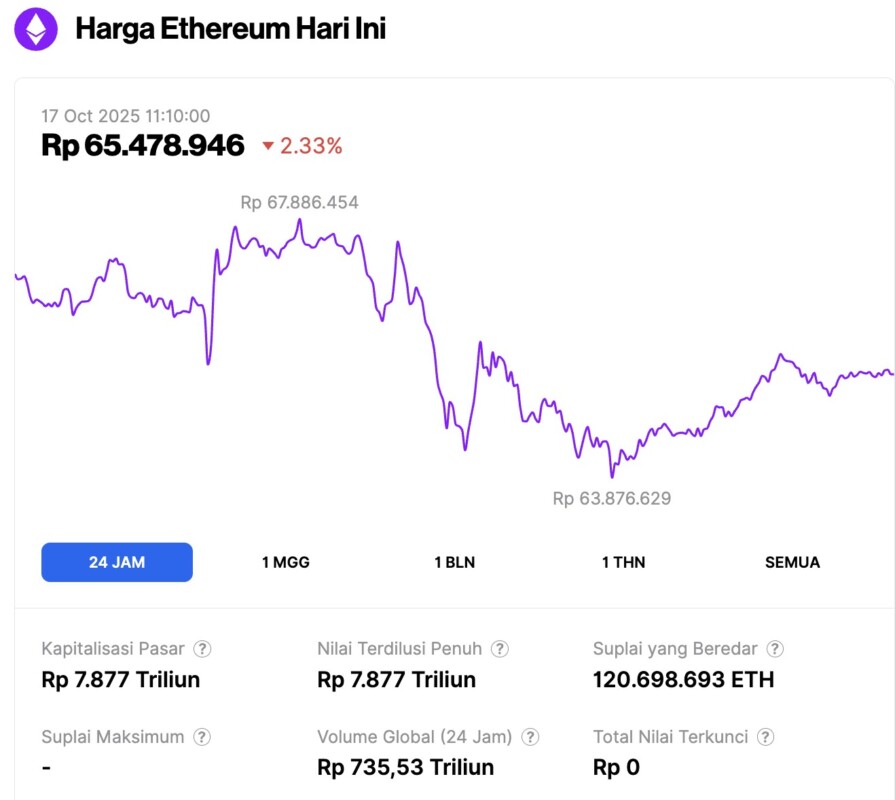
On October 17, 2025, Ethereum was trading at approximately IDR 65,478,946 (around $3,929), marking a 2.33% decline over the past 24 hours. During the same period, ETH reached a low of IDR 63,876,629 and a high of IDR 67,886,454.
At the time of writing, Ethereum’s market capitalization stands at roughly IDR 7,877 trillion, while its daily trading volume has increased by 1% to IDR 735.53 trillion over the last 24 hours.
Read also: Bitcoin Drops to $109,000 Today, But Bitwise Sees a Prime Opportunity for Accumulation
Bullish Divergence Reappears Amid Surge in Outflows from Exchanges
The Relative Strength Index (RSI), which measures the speed and strength of price movements, shows a bullish divergence. This occurs when the price prints a new low, but the RSI forms a higher low – a sign that selling pressure is starting to weaken.
Bullish divergences are often an early indication of a potential trend reversal, which means the downtrend could be nearing its end. The last time Ethereum showed this pattern clearly was between March 10 and April 21, when its price rose by 84.46%.
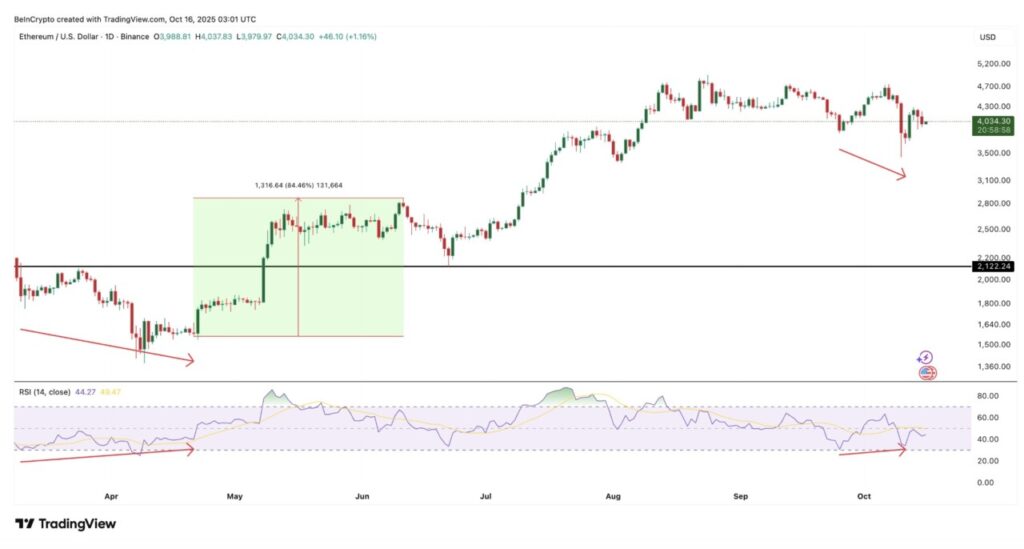
Prior to the reversal, Ethereum also experienced a similar decline. The pattern that has now reappeared could be a signal that the current downtrend is likely to reverse soon.
Ethereum whales – i.e. wallets that hold large amounts of ETH – seem to have started preparing early.
On-chain data shows that these wallets increased their holdings from 100.36 million ETH on October 14 to 100.51 million ETH two days later. This means an addition of about 150,000 ETH, equivalent to about $603 million at the current ETH price.
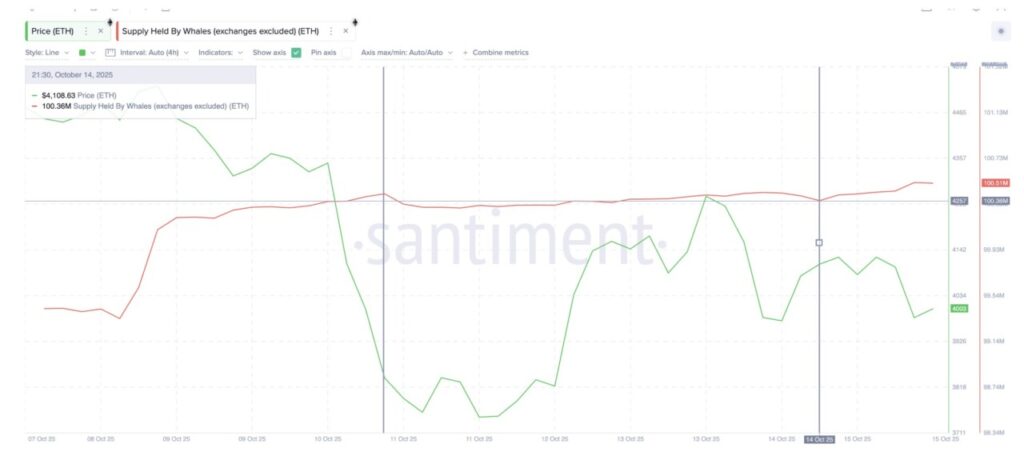
Although the accumulation has been slow, this move shows that big players are starting to rebuild their positions amid the market recovery process.
Ethereum Has the Potential to Surge?
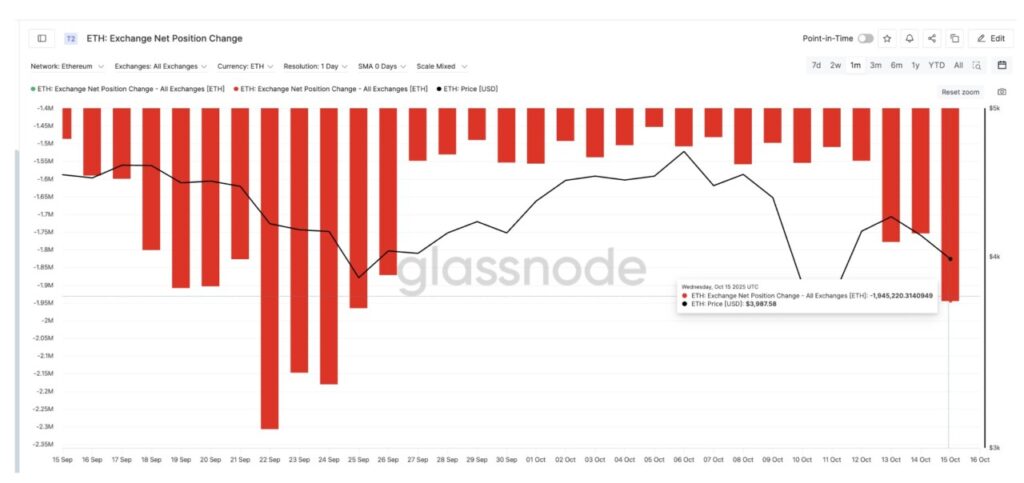
At the same time, the Exchange Net Position Change data – which tracks how much ETH enters and leaves the exchange – showed a further decline, from -1.55 million ETH on October 10 to -1.94 million ETH on October 15.
This negative number means that more ETH is being pulled out of exchanges than is coming in – a sign of increased buying pressure as investors move their assets into long-term storage. This 25% spike in outflows is the highest level since September 25.
Read also: Trump Tariffs: China Signals Willingness to Cooperate as Trade Tensions Send Crypto Market Plunging
When combined with the accumulation trend of the whales, this could be a sign that the market is bracing for a potential surge in Ethereum’s price.
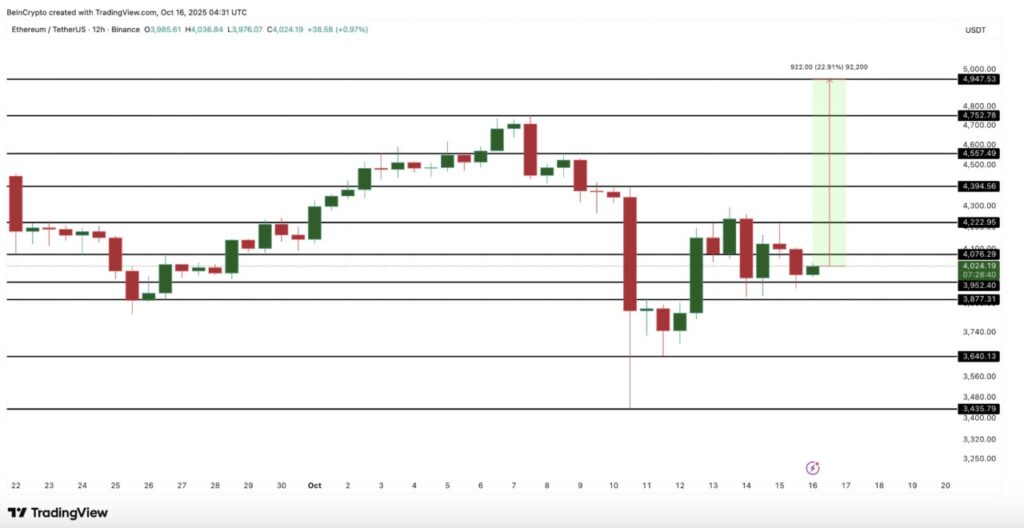
Ethereum price faces critical test around $4,076
Technically, Ethereum is currently facing immediate resistance in the range of $4,076. If it manages to break this level, the next upside targets are at $4,222 and $4,557.
A clean close in the 12-hour timeframe above $4,076 could be a confirmation of the strength of the bullish signal. It would also pave the way towards $4,752 to $4,947 – the all-time high area.
On the downside, Ethereum has important support levels around $3,952 and $3,877. If these two levels fail to hold, the price could potentially drop deeper towards $3,640, which would invalidate the current uptrend (bullish) structure.
Overall, Ethereum’s current technical condition combines three main bullish elements: strong momentum signals (RSI divergence), accumulation by large investors (whales), and a sharp spike in outflows from exchanges.
If this structure holds and the price manages to break $4,076 and $4,222, ETH could repeat the bullish recovery pattern that occurred in March – where a weakening downtrend turned into a multi-week rally.
That’s the latest information about crypto. Follow us on Google News to get the latest crypto news about crypto projects and blockchain technology. Also, learn crypto from scratch with complete discussion through Pintu Academy and stay up-to-date with the latest crypto market such as bitcoin price today, xrp coin price today, dogecoin and other crypto asset prices through Pintu Market.
Enjoy an easy and secure crypto trading experience by downloading Pintu crypto app via Google Play Store or App Store now. Also, get a web trading experience with various advanced trading tools such as pro charting, various types of order types, and portfolio tracker only at Pintu Pro.
*Disclaimer
This content aims to enrich readers’ information. Pintu collects this information from various relevant sources and is not influenced by outside parties. Note that an asset’s past performance does not determine its projected future performance. Crypto trading activities have high risk and volatility, always do your own research and use cold cash before investing. All activities of buying and selling bitcoin and other crypto asset investments are the responsibility of the reader.
Reference:
- BeInCrypto. Ethereum Price at $4076: Bullish Signal in Focus. Accessed on October 17, 2025
Latest News
© 2026 PT Pintu Kemana Saja. All Rights Reserved.
The trading of crypto assets is carried out by PT Pintu Kemana Saja, a licensed and regulated Digital Financial Asset Trader supervised by the Financial Services Authority (OJK), and a member of PT Central Finansial X (CFX) and PT Kliring Komoditi Indonesia (KKI). Crypto asset trading is a high-risk activity. PT Pintu Kemana Saja do not provide any investment and/or crypto asset product recommendations. Users are responsible for thoroughly understanding all aspects related to crypto asset trading (including associated risks) and the use of the application. All decisions related to crypto asset and/or crypto asset futures contract trading are made independently by the user.