Bitcoin Surges to $109,000 Today, Signaling a Potential Breakout Ahead
Jakarta, Pintu News – Bitcoin (BTC) experienced a nearly 4% increase on October 20, 2025 and briefly traded around $111,346, extending the overall crypto market recovery trend.
Despite the rebound, Bitcoin price still recorded a 3.8% drop in the last 30 days, signaling that the bullish momentum has not fully recovered.
However, a number of on-chain metrics and technical signals indicate that Bitcoin has the potential to make a stronger push – especially if it is able to break key resistance levels. So, how will Bitcoin price move today?
Bitcoin Price Rises 0.79% in 24 Hours
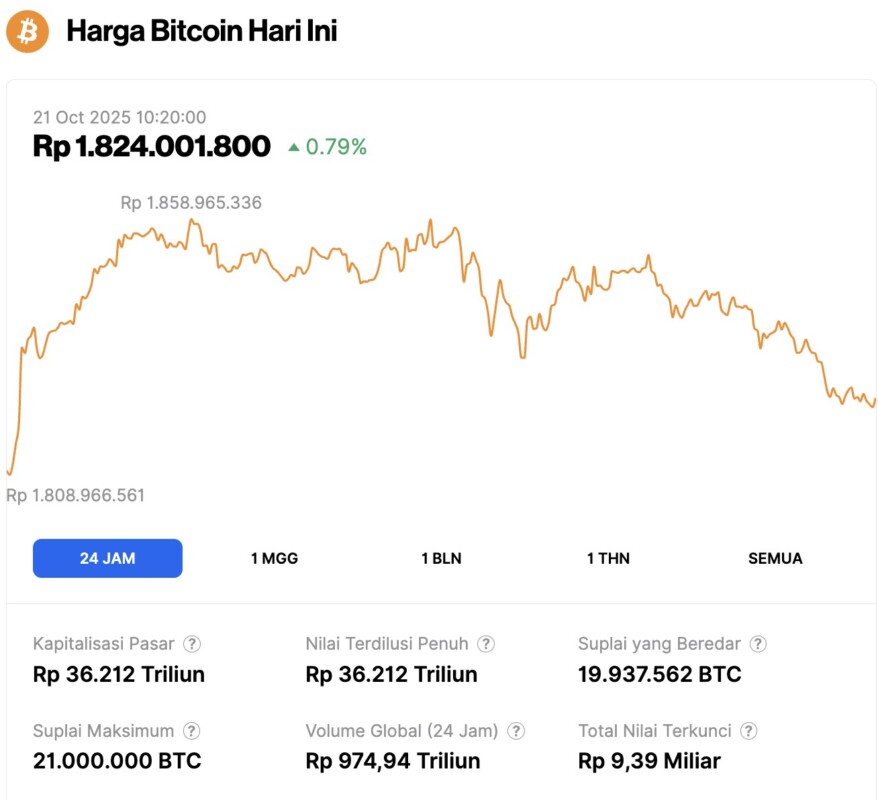
On October 21, 2025, Bitcoin was trading at $109,526, equivalent to IDR 1,824,001,800 — marking a 0.79% increase over the past 24 hours. During this period, BTC dipped to a low of IDR 1,808,966,561 and peaked at IDR 1,858,965,336.
At the time of writing, Bitcoin’s market capitalization is approximately IDR 36,212 trillion, while its 24-hour trading volume has risen by 15% to reach IDR 974.94 trillion.
Read also: 3 Unlock Tokens Worth Watching This Week, What Will Happen?
More Holders Start Buying Again, a Sign of Recovering Market Confidence
TheHolder Accumulation Ratio (SAR), which measures how much active holders are adding to positions versus subtracting, shows increased market confidence.
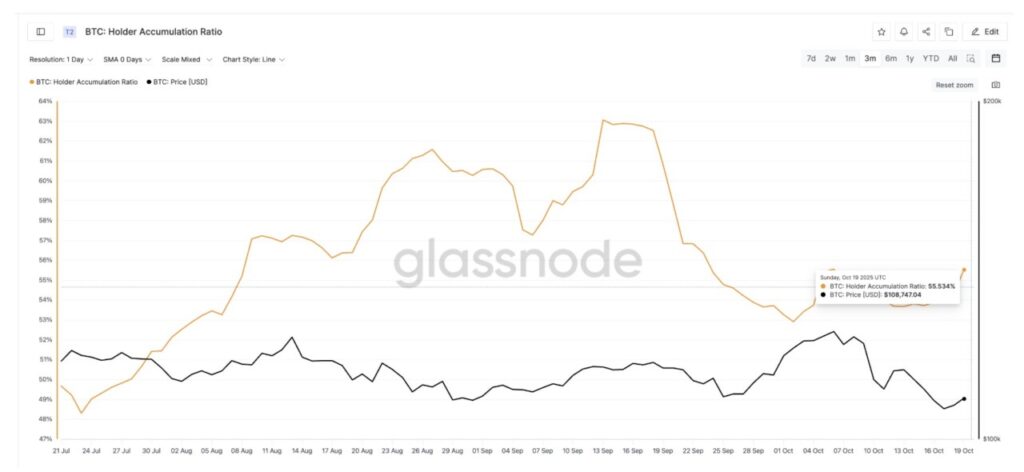
Although it had been declining since September 13 and bottomed out at 52.91% in early October, it has since rebounded to 55.53%. This indicates that accumulation behavior is starting to reappear.
When HAR is above 50%, it usually signals that long-term holders are buying more than selling-a bullish signal.
Positive signals also came from the Net Unrealized Profit/Loss (NUPL) metric, which indicates whether the overall market is in a profit or loss position. After hitting a three-month low of 0.48 on October 17, the NUPL value started to show an upward trend.
As NUPL is still below 0.50 and near a three-month low, selling pressure due toprofit-taking is not a significant obstacle at the moment.
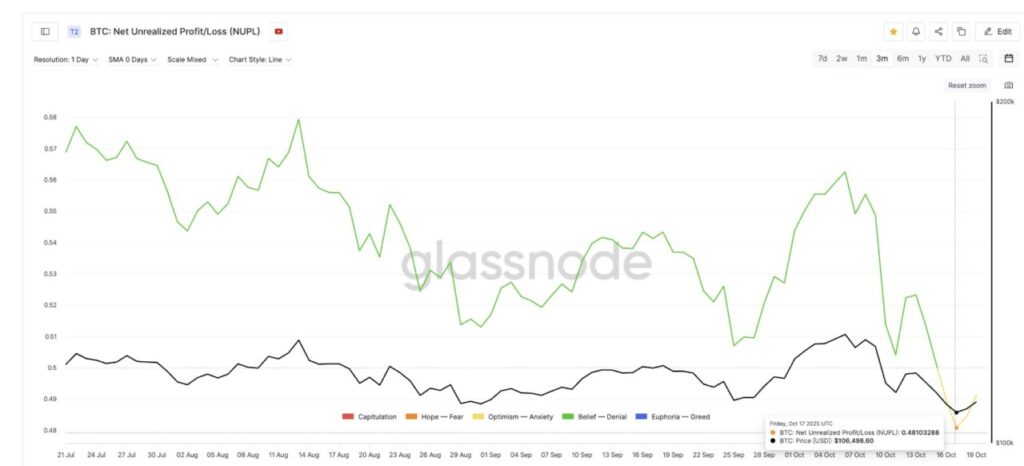
Historically, a similar drop last October 11 was followed by a rapid rally from $110,810 to $115,321 (up about 4%) in just two days. This pattern signals that Bitcoin may be entering another accumulation phase before a breakout.
The combination of these two on-chain indicators suggests that investor confidence and profit potential are recovering, although general market sentiment is still cautious.
Read also: Bitcoin Freefalls as Gold Price Peaks: Will Uptober Bounce Back?
Bitcoin price chart pattern hints at potential breakout if $114,000 level is broken
In the daily chart (10/20), Bitcoin is currently trading within a falling wedge pattern-abullish reversal pattern that often precedes an upward movement. This structure is characterized by two downward-converging trend lines, with gradually decreasing trading volume, confirming the validity of the pattern.
Typically, this pattern ends with an upward breakout over the upper trendline, supported by increased volume and renewed buying pressure. As of October 20, BTC is hovering around $111,346 and has managed to turn the important resistance area at $108,918 into a new support level.
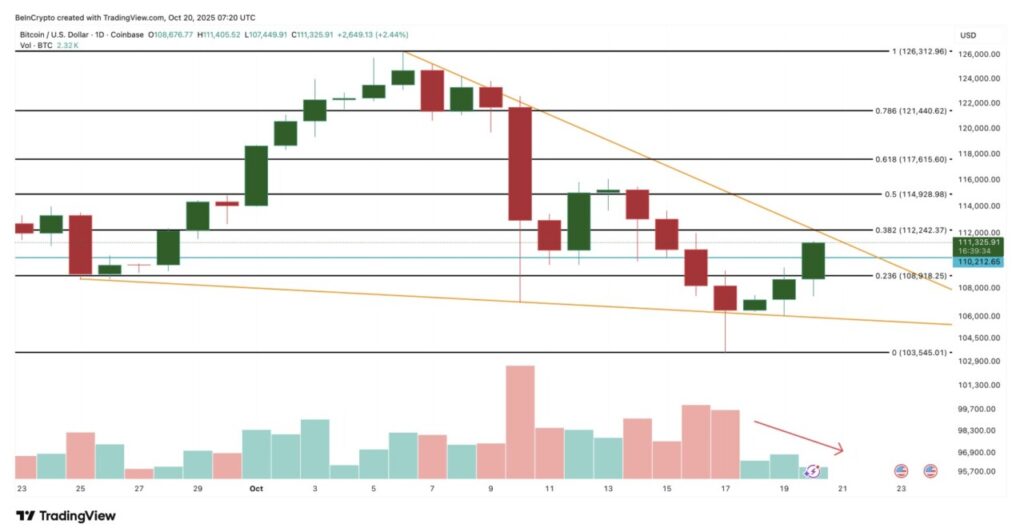
The next important level to watch is $112,242, which aligns with the upper boundary of the wedge pattern. A daily close above $114,928-a zone that has previously thwarted recovery attempts-would confirm a breakout.
If that happens, the price has the potential to continue rising towards $117,615 and $121,440, about 5.6% and 9% higher than current levels, respectively.
However, if BTC fails to hold above $108,918, the short-term bullish bias could weaken, with a potential drop to the $103,545 area-which is the lower limit of the wedge pattern.
That’s the latest information about crypto. Follow us on Google News to get the latest crypto news about crypto projects and blockchain technology. Also, learn crypto from scratch with complete discussion through Pintu Academy and stay up-to-date with the latest crypto market such as bitcoin price today, xrp coin price today, dogecoin and other crypto asset prices through Pintu Market.
Enjoy an easy and secure crypto trading experience by downloading Pintu crypto app via Google Play Store or App Store now. Also, get a web trading experience with various advanced trading tools such as pro charting, various types of order types, and portfolio tracker only at Pintu Pro.
*Disclaimer
This content aims to enrich readers’ information. Pintu collects this information from various relevant sources and is not influenced by outside parties. Note that an asset’s past performance does not determine its projected future performance. Crypto trading activities have high risk and volatility, always do your own research and use cold cash before investing. All activities of buying and selling bitcoin and other crypto asset investments are the responsibility of the reader.
Reference:
- BeInCrypto. Bitcoin Price Relies on This 3-Month Low Signal to Go Bullish – If $114,900 Breaks. Accessed on October 21, 2025
Latest News
© 2026 PT Pintu Kemana Saja. All Rights Reserved.
The trading of crypto assets is carried out by PT Pintu Kemana Saja, a licensed and regulated Digital Financial Asset Trader supervised by the Financial Services Authority (OJK), and a member of PT Central Finansial X (CFX) and PT Kliring Komoditi Indonesia (KKI). Crypto asset trading is a high-risk activity. PT Pintu Kemana Saja do not provide any investment and/or crypto asset product recommendations. Users are responsible for thoroughly understanding all aspects related to crypto asset trading (including associated risks) and the use of the application. All decisions related to crypto asset and/or crypto asset futures contract trading are made independently by the user.