Whales Are Accumulating ASTER During the Dip — Here Are 4 Bullish Signs They’re Likely Watching
Jakarta, Pintu News – As of October 23, the price of Aster (ASTER) has dropped by about 4% in 24 hours, yet the big holders don’t seem to be backing down. Instead, they seem to be quietly preparing for the token’s next possible bull run.
On the chart, momentum began to change after several days of pressure, and a familiar pattern began to emerge. These early clues may be the signals that the whales are watching as they accumulate amid the price drop.
Whale Buying as Momentum Begins to Turn Positive
On-chain data shows that large Aster wallets continue to add to their holdings despite the price drop. In 24 hours (Oct 23), small whales increased their holdings by 2.3%, adding about 221,900 ASTER bringing their total to 9.87 million ASTER.
Read also: AAVE V4 Launch Drives Market Momentum Amid Accelerated DeFi Adoption!
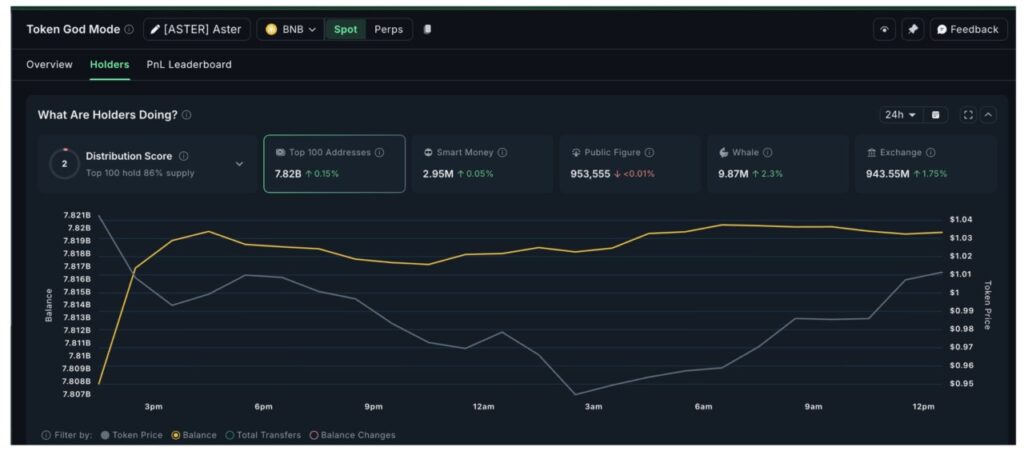
Meanwhile, the mega whales – the top 100 addresses – added about 0.15% to their portfolio, buying approximately 11.7 million ASTER and bringing their total holdings to 7.82 billion ASTER.
Overall, the whales have accumulated around 11.93 million ASTER in just one day – worth around $11.93 million based on ASTER’s current price. This kind of accumulation often occurs towards the end of a price decline phase, when well-capitalized investors begin to absorb selling pressure from weaker asset owners.
The whales seem to be responding to the change in momentum. The Moving Average Convergence Divergence (MACD) indicator, which compares short-term and long-term averages to gauge the strength of a trend, is now showing three bullish signals.
First, the histogram bars turn a lighter red – signaling that the selling pressure is starting to ease. The MACD line (blue) has now started to curve upwards towards the signal line (orange), signaling a possible bullish crossover.
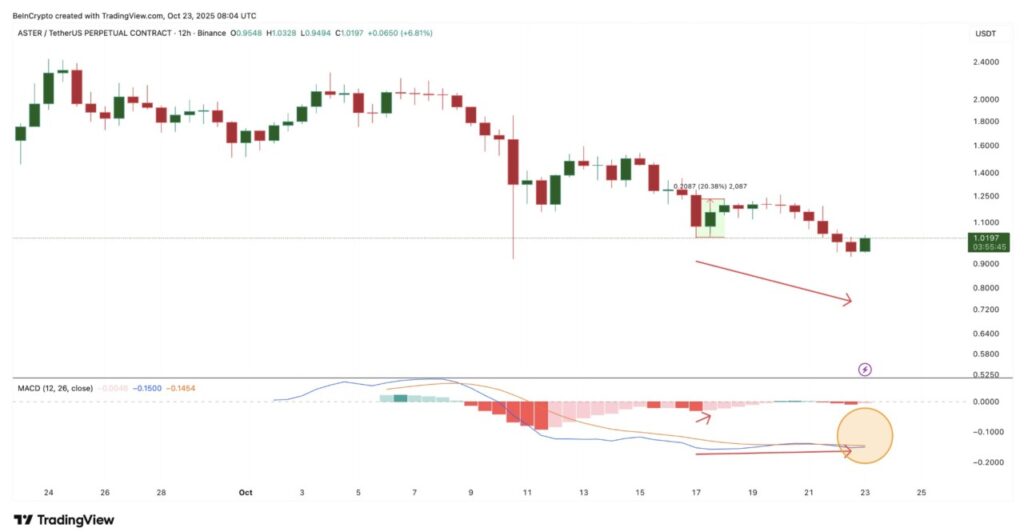
Third, there was a bullish divergence between October 17 and October 22 – where the price printed a new low, but the MACD printed a higher low, signaling that the downward pressure was starting to weaken.
Interestingly, when this brighter histogram pattern appeared on October 17, ASTER prices had risen by almost 20%. Now, with the addition of two new signals – a rising curve on the MACD and a bullish divergence – it is possible that the whales see a new bullish phase forming.
ASTER Price Structure Shows Reversal Pattern
On the broader chart, ASTER price formed a broadening falling wedge pattern – which became the fourth bullish signal in the current formation.
Unlike a typical wedge that narrows, this pattern widens, with each price swing showing widening highs and lows.
Such structures often appear ahead of sharp price reversals, when volatility increases and selling pressure starts to lose control.
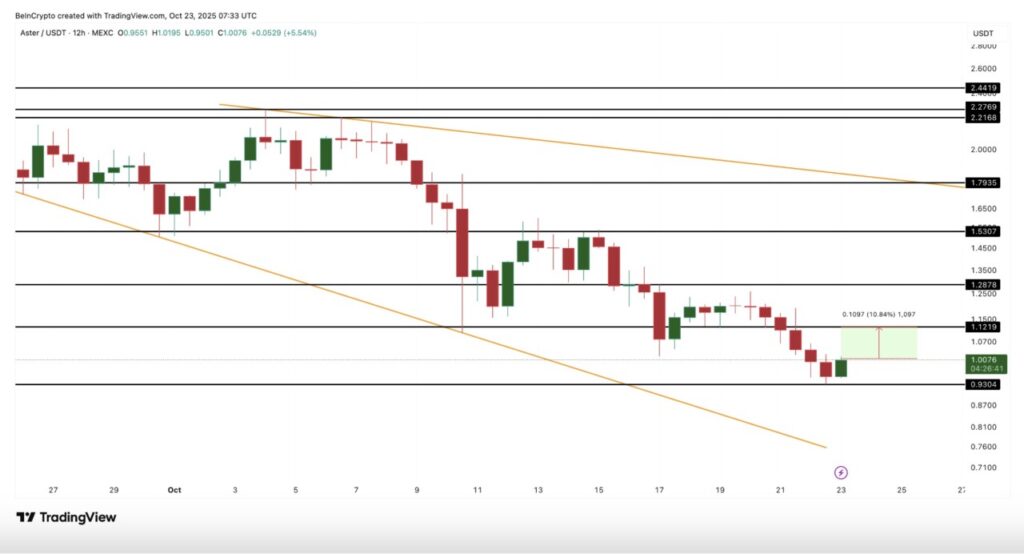
The $0.93 level remains the key support area, while $1.12 is the first resistance to break. If a breakout is confirmed above this level, the next upside target is in the range of $1.28 to $1.53.
If this bullish movement continues, ASTER has the potential to break out of the falling wedge pattern above the $1.79 level.
However, if the price breaks below $0.93, this bullish scenario will weaken and open up the possibility of a drop back to the $0.80 area.
That’s the latest information about crypto. Follow us on Google News to get the latest crypto news about crypto projects and blockchain technology. Also, learn crypto from scratch with complete discussion through Pintu Academy and stay up-to-date with the latest crypto market such as bitcoin price today, xrp coin price today, dogecoin and other crypto asset prices through Pintu Market.
Enjoy an easy and secure crypto trading experience by downloading Pintu crypto app via Google Play Store or App Store now. Also, get a web trading experience with various advanced trading tools such as pro charting, various types of order types, and portfolio tracker only at Pintu Pro.
*Disclaimer
This content aims to enrich readers’ information. Pintu collects this information from various relevant sources and is not influenced by outside parties. Note that an asset’s past performance does not determine its projected future performance. Crypto trading activities have high risk and volatility, always do your own research and use cold cash before investing. All activities of buying and selling bitcoin and other crypto asset investments are the responsibility of the reader.
Reference:
- BeInCrypto. Aster Price: Whales Accumulation & Bullish Signs. Accessed on October 24, 2025
Latest News
© 2026 PT Pintu Kemana Saja. All Rights Reserved.
The trading of crypto assets is carried out by PT Pintu Kemana Saja, a licensed and regulated Digital Financial Asset Trader supervised by the Financial Services Authority (OJK), and a member of PT Central Finansial X (CFX) and PT Kliring Komoditi Indonesia (KKI). Crypto asset trading is a high-risk activity. PT Pintu Kemana Saja do not provide any investment and/or crypto asset product recommendations. Users are responsible for thoroughly understanding all aspects related to crypto asset trading (including associated risks) and the use of the application. All decisions related to crypto asset and/or crypto asset futures contract trading are made independently by the user.