Bitcoin Falls to $113,000 as Whale Activity Slows Down
Jakarta, Pintu News – Earlier this week (27/10), the price of Bitcoin (BTC) made another move, rising by 3.2% in 24 hours and leading a broader rise of 3.7% in the overall crypto market. In the past month, its value has increased by around 5%, suggesting that momentum is slowly picking up.
However, this rise has not been entirely smooth. Beneath the surface, there are two often overlooked but crucial metrics that are starting to show changes – and these could potentially slow down the next leg up, even though the overall outlook still looks positive.
Then, how is the current Bitcoin price movement?
Bitcoin Price Drops 1.09% in 24 Hours
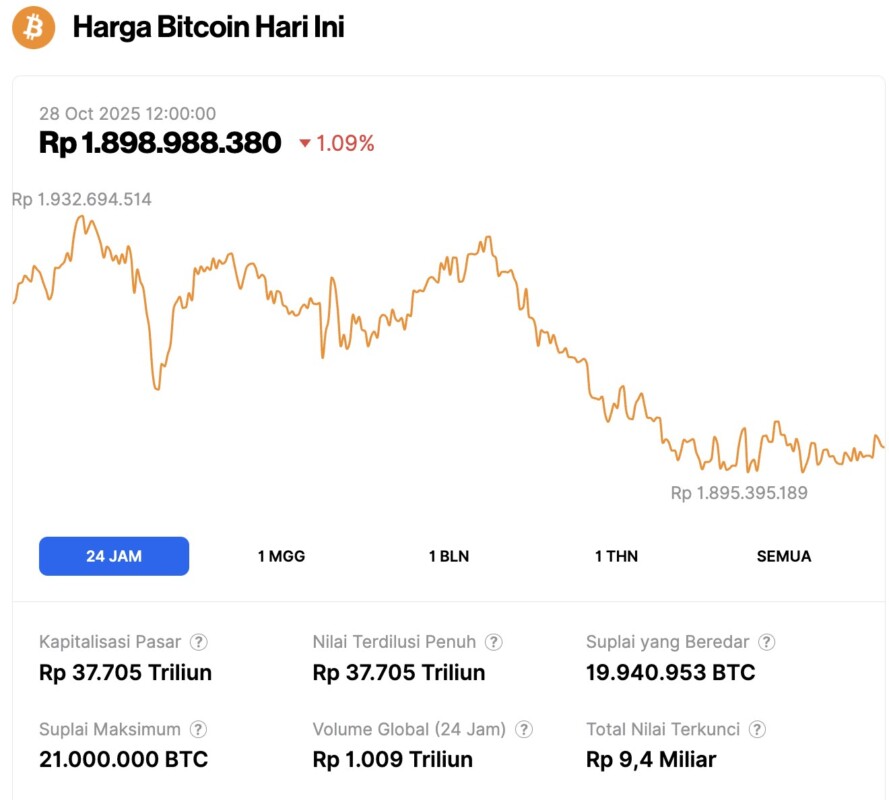
As of October 28, 2025, Bitcoin was priced at $113,934, or approximately IDR 1,898,988,380, reflecting a 1.09% decline over the past 24 hours. During this period, BTC hit a low of IDR 1,895,395,189 and reached a high of IDR 1,932,694,514.
At the time of writing, Bitcoin’s market capitalization is around IDR 37,705 trillion, while its 24-hour trading volume has jumped by 22% to IDR 1,009 trillion.
Read also: Crypto whales continue to invest in Bitcoin, can BTC jump to $116,000?
Whale Movement Starts to Decline, Exchange Outflows Slow Down
One important indicator to watch in the crypto market is the behavior of whales, which are wallet holders with large amounts-usually 1,000 BTC or more. Their activity often signals the direction in which the market is moving.
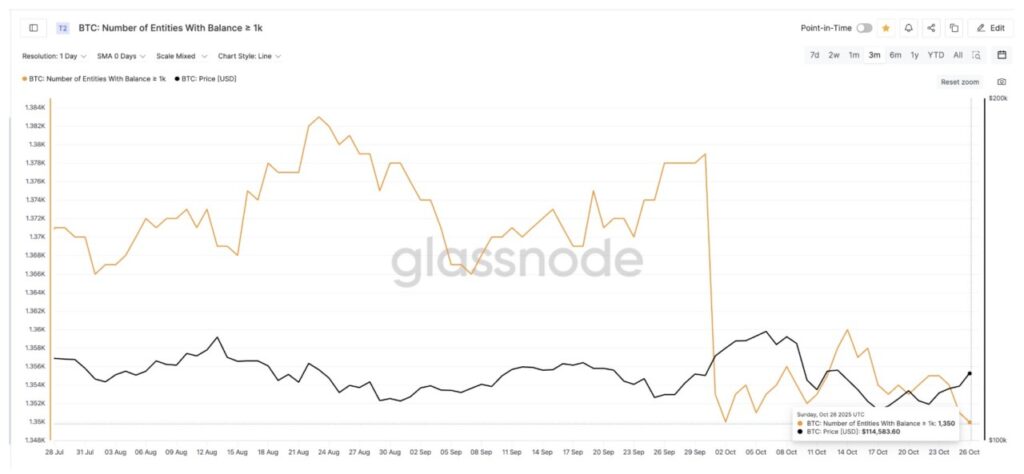
The latest data shows that the number of whale entities decreased to a three-month low of 1,350 wallets, and has been steadily decreasing since October 14. The first decline coincided with Bitcoin’s price correction from $115,000 to $106,400, a drop of about 7.4%.
This shows that some large holders have started profit-taking. This means that the current buying impulse comes more from small-scale retail investors, not from institutional players or large financiers.
Another supporting data is the exchange net position change metric, which records the movement of Bitcoin in and out of exchanges on a daily basis. Negative numbers indicate outflows (accumulation/buying), while positive numbers indicate inflows (selling).
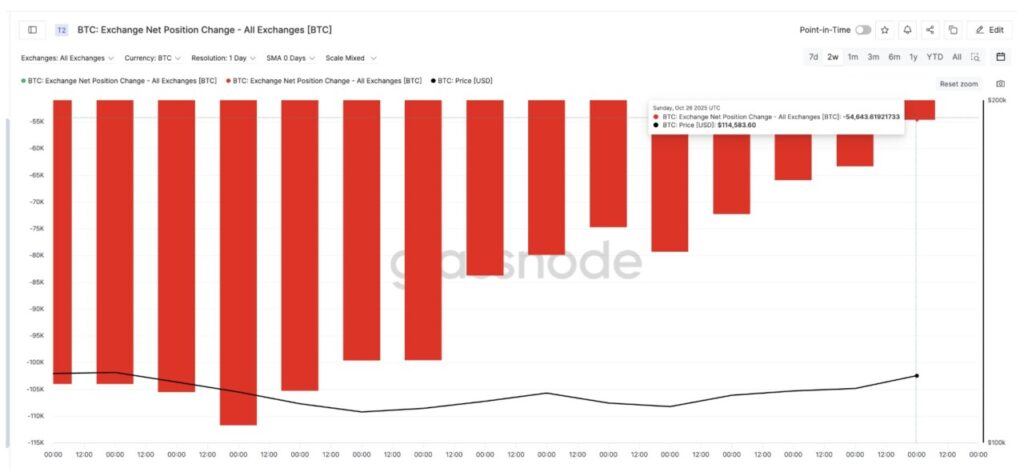
On October 15, outflows from the exchange reached 111,720 BTC, signaling very strong buying pressure. However, by October 26, the figure had dropped to 54,643 BTC, a drop of about 51%.
Although the outflow still shows accumulation, this slowdown indicates that the buying momentum is starting to weaken. There is a possibility that a short-term sell-off will emerge before the price bounces back to the next level.
Read also: Is the Altcoin Season Over? Here Are the Important Signals from the Ethereum Price Chart
Bullish Divergence Persists, but Bitcoin Price Tests Resistance Levels
Amid market volatility, the Relative Strength Index (RSI) indicator-which measures buying and selling strength-is still showing positive signals supporting the medium-term bullish view.
Since mid-October, the RSI has been forming a pattern of higher lows, although prices have been falling. This pattern is known as bullish divergence, which usually indicates that selling pressure is starting to weaken and buying power is slowly returning.
This RSI trend is in line with the current chart pattern. Bitcoin has confirmed the breakout from the falling wedge pattern, with the price holding above $111,000 and approaching $114,900.
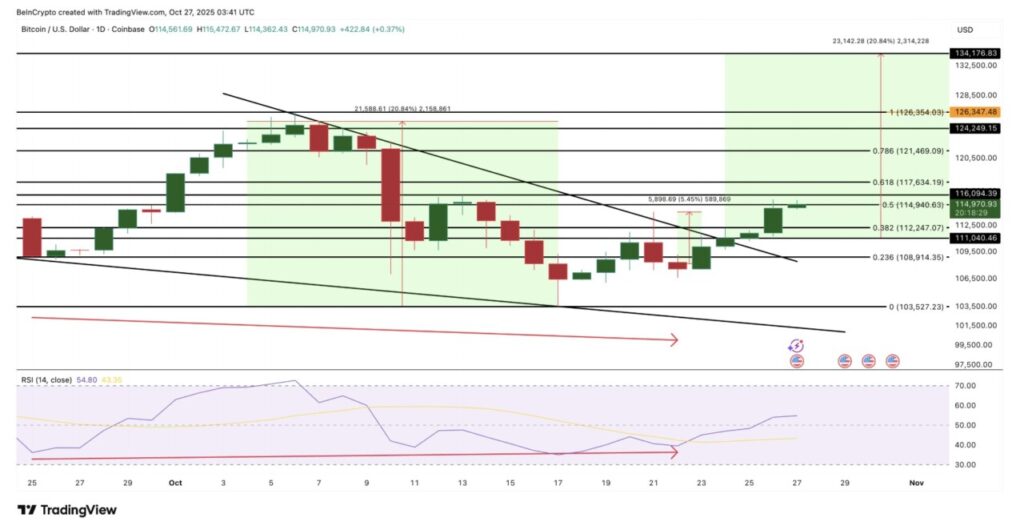
If the price is able to print a daily close above $117,600-which is a crucial resistance-then there is a chance for a continued rise towards the next resistance levels at $121,400 and $126,300, with a potential target near $134,100, which would be a new all-time high zone. This upside is equivalent to about 20% of the breakout level at $111,000.
However, if Bitcoin fails to maintain a position above $112,200, then a deeper price correction could occur. A drop below $108,900 (about 6% from the current level) would open the way towards $103,500, a level that was previously a strong support.
That’s the latest information about crypto. Follow us on Google News to get the latest crypto news about crypto projects and blockchain technology. Also, learn crypto from scratch with complete discussion through Pintu Academy and stay up-to-date with the latest crypto market such as bitcoin price today, xrp coin price today, dogecoin and other crypto asset prices through Pintu Market.
Enjoy an easy and secure crypto trading experience by downloading Pintu crypto app through Google Play Store or App Store now. Also, get a web trading experience with various advanced trading tools such as pro charting, various types of order types, and portfolio tracker only at Pintu Pro.
*Disclaimer
This content aims to enrich readers’ information. Pintu collects this information from various relevant sources and is not influenced by outside parties. Note that an asset’s past performance does not determine its projected future performance. Crypto trading activities have high risk and volatility, always do your own research and use cold cash before investing. All activities of buying and selling bitcoin and other crypto asset investments are the responsibility of the reader.
Reference:
- Bitcoin Breaks Out – But Whale Slowdown Signals a Pullback Ahead of Next All-Time High. Accessed on October 28, 2025
Latest News
© 2026 PT Pintu Kemana Saja. All Rights Reserved.
The trading of crypto assets is carried out by PT Pintu Kemana Saja, a licensed and regulated Digital Financial Asset Trader supervised by the Financial Services Authority (OJK), and a member of PT Central Finansial X (CFX) and PT Kliring Komoditi Indonesia (KKI). Crypto asset trading is a high-risk activity. PT Pintu Kemana Saja do not provide any investment and/or crypto asset product recommendations. Users are responsible for thoroughly understanding all aspects related to crypto asset trading (including associated risks) and the use of the application. All decisions related to crypto asset and/or crypto asset futures contract trading are made independently by the user.