Secrets of Using MACD Indicator to Maximize Investment Profits
Jakarta, Pintu News – The use of technical indicators in trading stocks or cryptocurrencies such as Bitcoin (BTC) and Ethereum (ETH) has become a common practice among investors. One of the most commonly used indicators is the Moving Average Convergence/Divergence (MACD), which was developed by Gerald Appel in the 1970s. This article will explain how MACD works and how traders can utilize it to identify market trends and momentum.
MACD Introduction
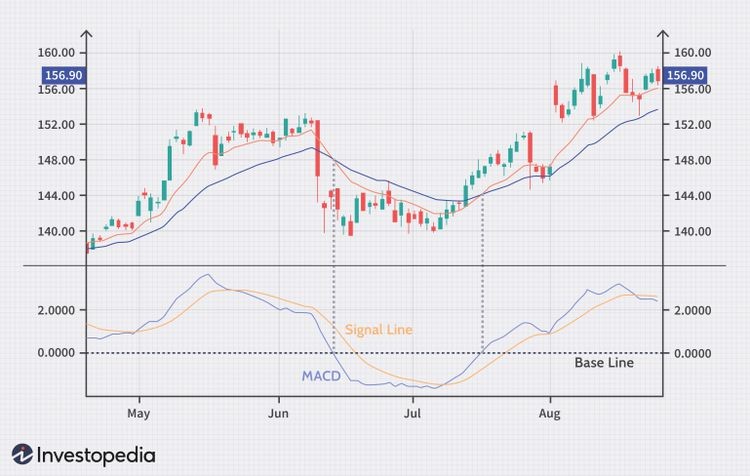
MACD is an indicator that measures the momentum and direction of an asset’s price trend. It calculates the difference between the short-term Exponential Moving Average (EMA) (12 periods) and the long-term EMA (26 periods). The result of this subtraction produces the MACD line, which is then compared to the nine-day EMA known as the signal line.
This MACD line and signal line provide a clear visualization of how the asset price is moving. When the MACD line crosses the signal line upwards, it indicates a possible buy signal, while a downward trajectory indicates a sell signal. This helps traders in making the right decision at the right time.
Also Read: Potential DOGE Explosion November 2025: Technical Analysis Shows Sharp Rise?
Understanding MACD Signals and Divergence
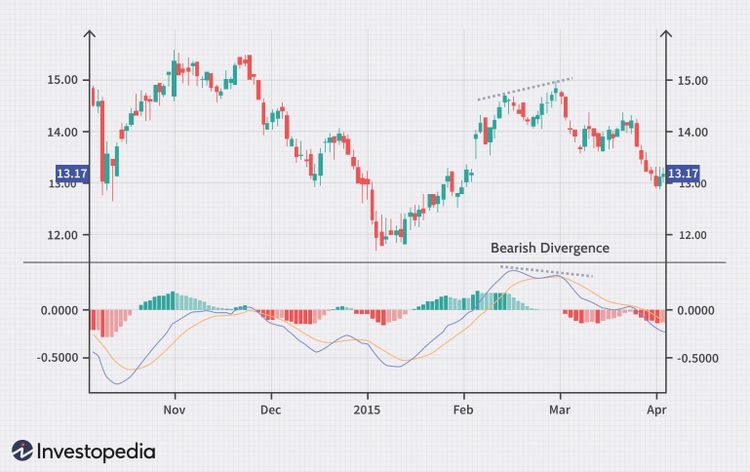
One of the main uses of the MACD is the identification of divergences. A bullish divergence occurs when the price of an asset reaches a new low, but the MACD line does not, indicating a possible upward trend reversal. Conversely, a bearish divergence occurs when the price reaches a new high but the MACD does not, which can be a signal to sell.
These divergences are very important as they often precede significant price trend changes, giving traders the opportunity to enter or exit the market before major price movements occur. However, it is important to use other indicators for confirmation as MACD can give false signals if used alone.
MACD Comparison with Other Indicators
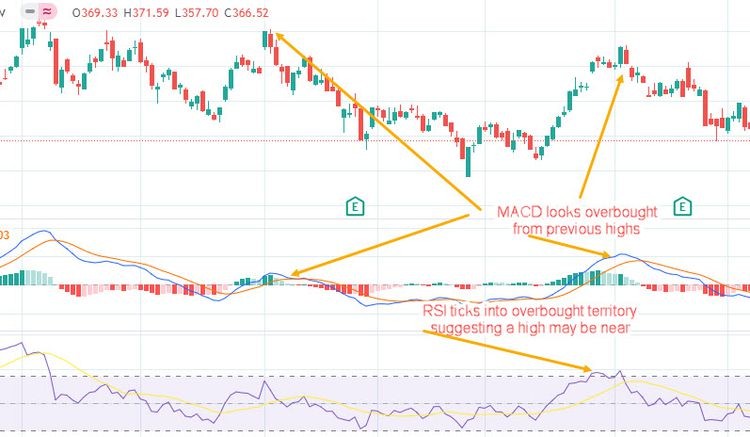
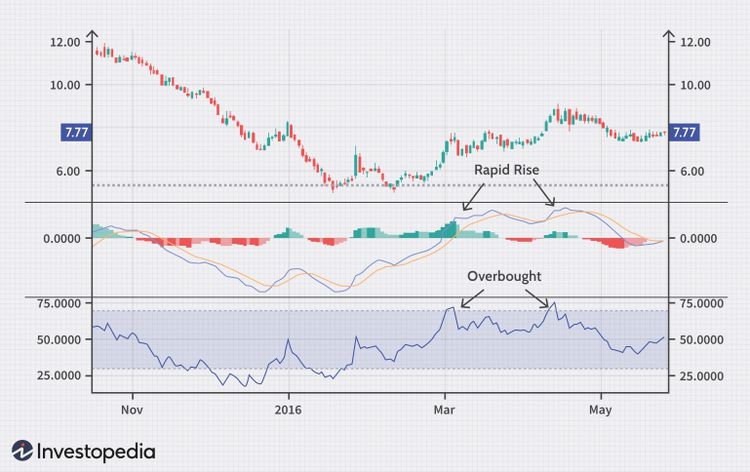
MACD is often compared to the Relative Strength Index (RSI), which is also popular among traders. While both of these indicators measure momentum, they do so in different ways. RSI focuses on speed and price changes to determine overbought or oversold conditions, while MACD focuses more on the relationship between the two EMAs to identify potential trend changes.
It’s important to understand that the MACD is a lagging indicator, meaning that it relies on historical price data. This means that the signals generated may not fully reflect current trend changes. Therefore, traders often combine MACD with other indicators such as the Average Directional Index (ADX) to get a more accurate picture of market conditions.
Conclusion
MACD is an invaluable tool in technical analysis, especially in identifying changes in market trends and momentum. By understanding how the MACD works and combining it with other indicators, traders can increase the likelihood of success in trading. However, like all technical analysis tools, MACD is not perfect and should be used in conjunction with comprehensive market analysis.
Also Read: Bitcoin Reserve Drop on Binance: A Bullish Signal for BTC Price in November 2025?
Follow us on Google News to get the latest information about the world of crypto and blockchain technology. Check today‘ s bitcoin price, today’s solana price, pepe coin and other crypto asset prices through Pintu Market.
Enjoy an easy and secure crypto trading experience by downloading Pintu crypto app via Google Play Store or App Store now. Also, get a web trading experience with various advanced trading tools such as pro charting, various types of order types, and portfolio tracker only at Pintu Pro.
*Disclaimer
This content aims to enrich readers’ information. Pintu collects this information from various relevant sources and is not influenced by outside parties. Note that an asset’s past performance does not determine its projected future performance. Crypto trading activities are subject to high risk and volatility, always do your own research and use cold hard cash before investing. All activities of buying andselling Bitcoin and other crypto asset investments are the responsibility of the reader.
Reference
- Investopedia. MACD (Moving Average Convergence Divergence). Accessed on October 28, 2025
Latest News
© 2026 PT Pintu Kemana Saja. All Rights Reserved.
The trading of crypto assets is carried out by PT Pintu Kemana Saja, a licensed and regulated Digital Financial Asset Trader supervised by the Financial Services Authority (OJK), and a member of PT Central Finansial X (CFX) and PT Kliring Komoditi Indonesia (KKI). Crypto asset trading is a high-risk activity. PT Pintu Kemana Saja do not provide any investment and/or crypto asset product recommendations. Users are responsible for thoroughly understanding all aspects related to crypto asset trading (including associated risks) and the use of the application. All decisions related to crypto asset and/or crypto asset futures contract trading are made independently by the user.