3 Bullish Signals For Virtuals Protocol (VIRTUAL) Price
Jakarta, Pintu News – Virtuals Protocol (VIRTUAL) has surged nearly 88% in the past week and is now hovering around $1.45. Although it looks like a pause after the big run-up, some indicators below the surface are showing bullish signals for VIRTUAL’s price. According to the analysis of Ananda Banerjee, crypto analyst at BeInCrypto, there are three strong signs that suggest that this token may be gearing up for its next leg up!
Pattern is Strong, Divergence Shows Strength
On the 12-hour chart, VIRTUAL is consolidating within a bullish flag pattern (pole and flag), which formed after a sharp rally when traders took a break before pushing higher again. The pattern is getting tighter near the upper trendline, indicating that pressure is building for a breakout.
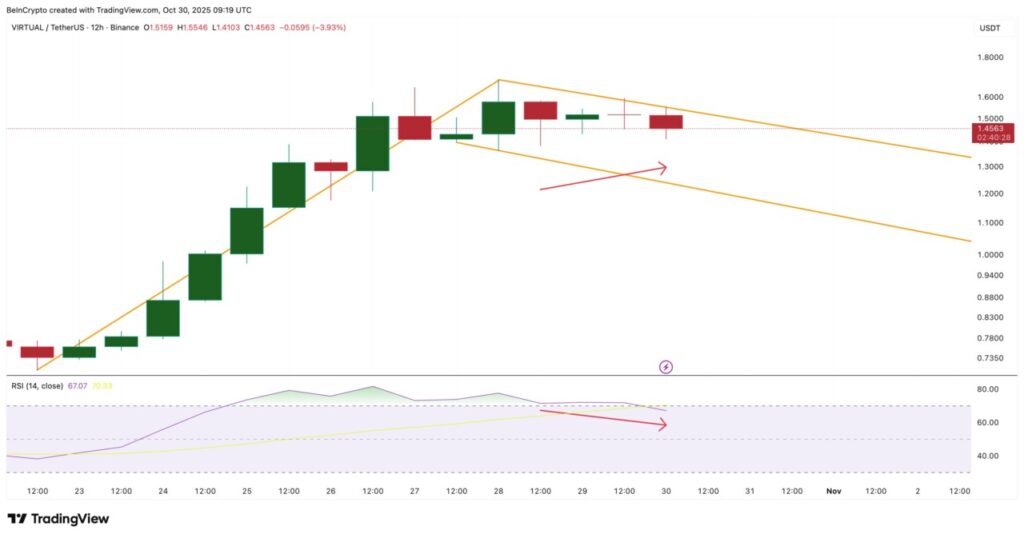
Between October 28 and 30, the token price registered a higher low, while the Relative Strength Index (RSI) registered a lower low. This phenomenon, called hidden bullish divergence, occurs during flag-based consolidation. The RSI measures the strength of buying versus selling, and in the case of VIRTUAL, it indicates bullish continuation. In short, sellers’ control is weakening despite slowing price growth.
Also read: Ripple (XRP) Whale Indicator Shows Buy Signal, Is a Price Rise Awaiting?
Moving Average Adds Weight to Breakout Cases
Adding to the bullish pressure, the 50-period Exponential Moving Average (EMA) is about to cross above the 100-period EMA. EMAs smoothen price data to highlight recent momentum trends. When the shorter EMA crosses above the longer one, it often marks the beginning of a new bullish phase.
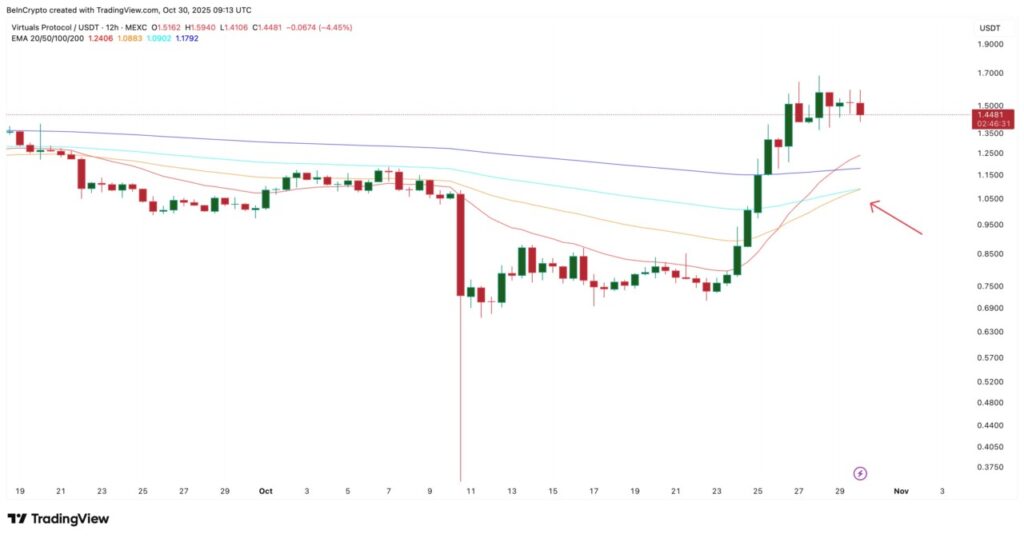
This crossover occurred just as the VIRTUAL price tested the upper flag limit. This is a rare alignment that strengthens the breakout hypothesis. If the EMA crossover and the close above the upper trendline occur together, it could act as a double confirmation of strength.
Also read: First Spot Shiba Inu ETF in the US Filed by T. Rowe Price, SHIB Adoption Ready to Surge?
Smart-Money Builds Position Ahead of VIRTUAL Price Movement
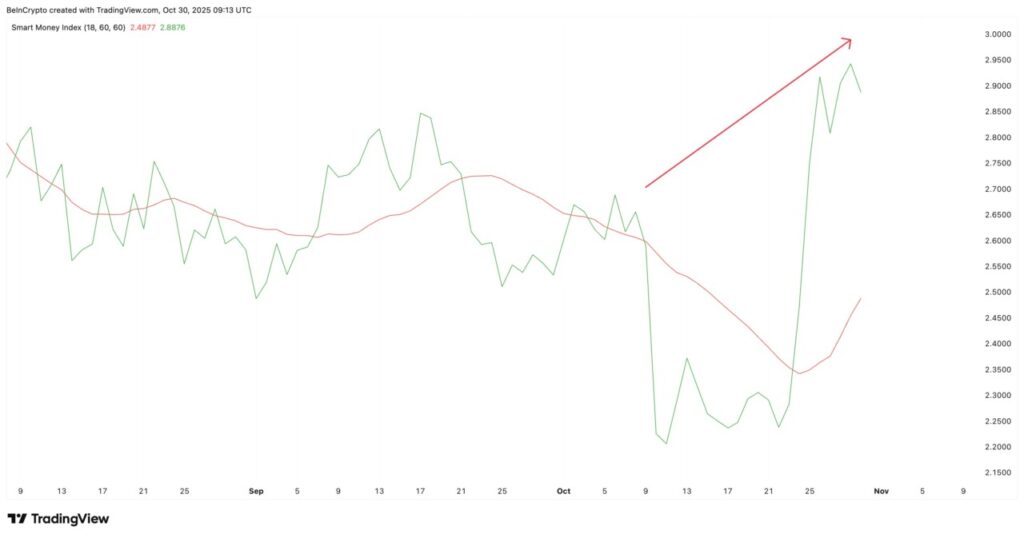
While retail traders may be waiting for clearer signals, smart money – the term used for experienced or institutional investors – is already showing its cards. The Smart Money Index (SMI), which tracks the flow of funds from informed traders, has been trending upwards since early October, although there have been a few dips along the way.
The index consistently records higher highs, even as prices consolidate, suggesting stealth accumulation behind the scenes. Increased smart money activity usually precedes price expansion, suggesting that big players expect the flag to split higher.
Conclusion
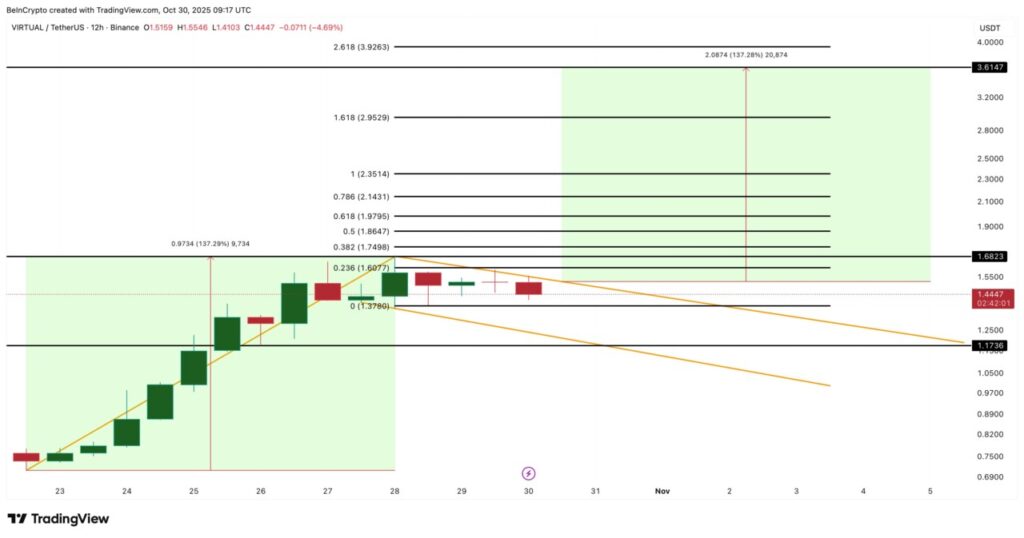
If VIRTUAL’s breakout above $1.60 holds, the potential upside targets are at $3.61 (per pole projection) and $3.92, according to Fibonacci projections. However, after the breakout, VIRTUAL may find the strongest resistance near $1.97 (before the $2 psychological barrier) and $2.95 (before $3). However, if the support at $1.37 followed by $1.17 breaks, it will likely invalidate this setup, which will signal a longer consolidation phase.
That’s the latest information about crypto. Follow us on Google News to get the latest crypto news about crypto projects and blockchain technology. Also, learn crypto from scratch with complete discussion through Pintu Academy and stay up-to-date with the latest crypto market such as bitcoin price today, xrp coin price today, dogecoin and other crypto asset prices through Pintu Market.
Enjoy an easy and secure crypto trading experience by downloading Pintu crypto app via Google Play Store or App Store now. Also, get a web trading experience with various advanced trading tools such as pro charting, various types of order types, and portfolio tracker only at Pintu Pro.
*Disclaimer
This content aims to enrich readers’ information. Pintu collects this information from various relevant sources and is not influenced by outside parties. Note that an asset’s past performance does not determine its projected future performance. Crypto trading activities have high risk and volatility, always do your own research and use cold cash before investing. All activities of buying and selling bitcoin and other crypto asset investments are the responsibility of the reader.
Reference
- BeInCrypto. Virtual Price Breakout: 3 Bullish Signs. Accessed on October 31, 2025
- Featured Image: Binance
Latest News
© 2026 PT Pintu Kemana Saja. All Rights Reserved.
The trading of crypto assets is carried out by PT Pintu Kemana Saja, a licensed and regulated Digital Financial Asset Trader supervised by the Financial Services Authority (OJK), and a member of PT Central Finansial X (CFX) and PT Kliring Komoditi Indonesia (KKI). Crypto asset trading is a high-risk activity. PT Pintu Kemana Saja do not provide any investment and/or crypto asset product recommendations. Users are responsible for thoroughly understanding all aspects related to crypto asset trading (including associated risks) and the use of the application. All decisions related to crypto asset and/or crypto asset futures contract trading are made independently by the user.