Ethereum Climbs to $2,900 Today: Is a Bigger Rally on the Horizon?
Jakarta, Pintu News – The price of Ethereum (ETH) is trading around $2,900, having recovered from last week’s sharp decline that briefly touched the liquidity area around $2,525. This bounce has boosted short-term momentum, but the overall price movement structure remains bearish.
ETH is still in a steep descending channel pattern, where every time the price tries to test the upper limit of the channel, selling pressure continues to appear and maintain it. So, how will Ethereum price move today?
Ethereum Price Up 2.16% in 24 Hours
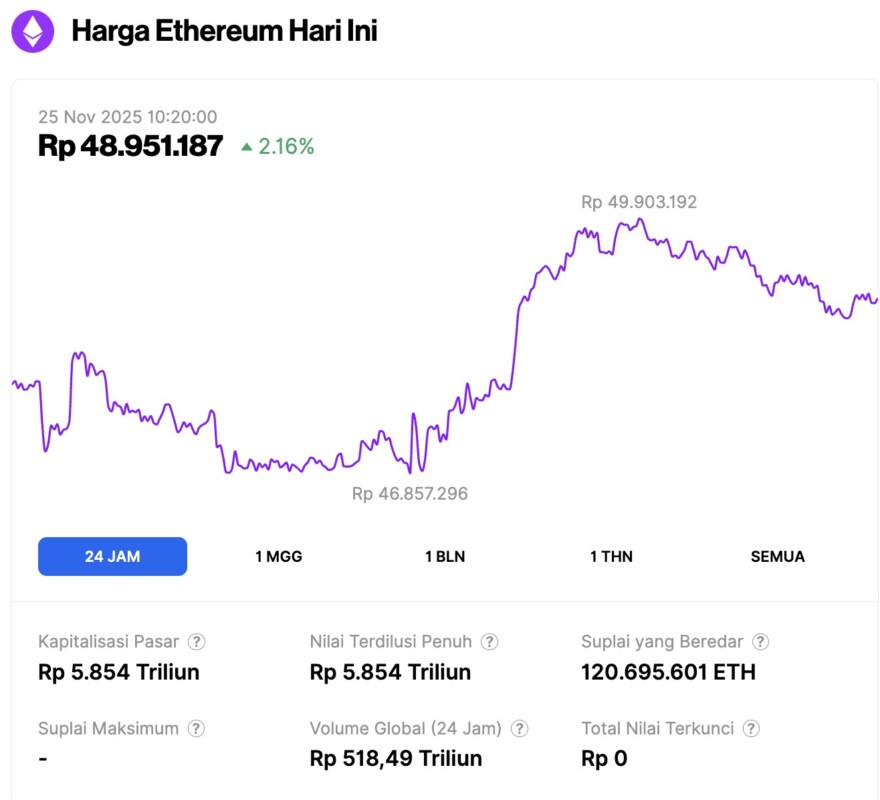
On November 25, 2025, Ethereum was trading at approximately $2,927, or around IDR 48,951,187 — marking a 2.16% increase over the past 24 hours. During that period, ETH dipped to a low of IDR 46,857,296 and reached a high of IDR 49,903,192.
At the time of writing, Ethereum’s market capitalization is estimated at about IDR 5,854 trillion, while its daily trading volume has surged 44% in the last 24 hours to reach IDR 518.49 trillion.
Read also: Bitcoin Holds Steady at $87,000, Is a 10–12% Price Surge on the Horizon?
ETH recovery pushes price to upper limit of channel, but structure is still heavy
ETH’s price recovery from the $2,525 level has pushed it back towards the centerline of the descending channel that has been directing its downward movement since September.
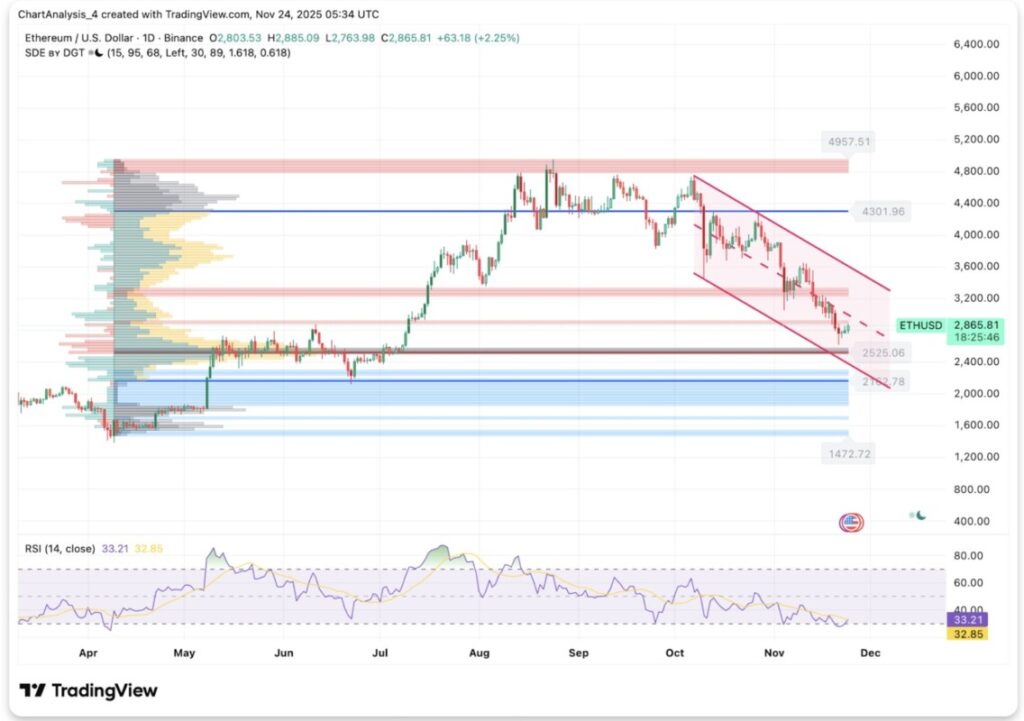
This reaction suggests that buyers are starting to enter in a crucial liquidity region characterized in the volume profile, but the main trend still shows no signs of reversal. The upper limit of the channel is currently in the range of $3,050 to $3,120, coinciding with the area of strong resistance formed in early November.
Meanwhile, the RSI indicator on the daily chart is still hovering around 33, signaling that ETH briefly bounced back fromoversold territory. However, on previous occasions, bounces at similar RSI levels within this channel failed to sustain the upside momentum, reinforcing the signal that downside pressure still dominates in the larger time frame.
ETH Attempts to Break Intraday Trendline as EMA Tightens above Price
On the 2-hour chart (11/24), ETH is attempting to break out of the downtrend line that since mid-November has been the barrier to any short-term(intraday) upside attempts. This breakout attempt is starting to show, but the pressure from above is still strong as the 20, 50, and 100 EMA lines are now converging tightly around the $2,815 to $2,947 price range.
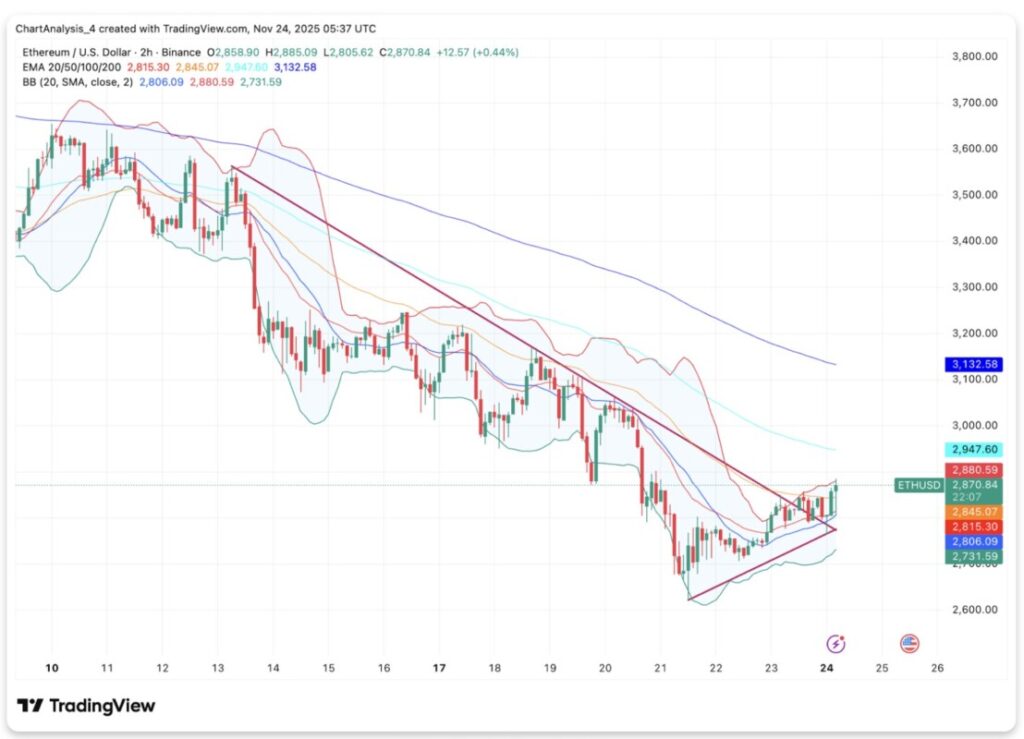
The first decisive battle is around the $2,947 level, where the 100 EMA on the 2-hour chart aligns with the upper band of the Bollinger Band. If the price is rejected at this level, the scenario could mirror previous failures and push ETH back down towards $2,806, which is the middle area of the Bollinger Band.
Momentum has indeed started to improve, but this is still happening under a declining EMA structure. Until ETH manages to convincingly break through the $2,947 to $3,000 resistance zone, any breakout remains vulnerable to rapid rejection.
Open Interest Rises, Buyers Increase Risk
Derivative positions showed that traders started to add exposure during the price bounce. Open interest increased by 2.30% to $34.57 billion, indicating that the recovery attracted new positions, not just short covering. Trading volume also jumped sharply by 25.65% to $73.14 billion, reinforcing the validity of this move.
The long-short ratio shows a clear change in sentiment. The long-short ratio of top traders on Binance is above 2.85, while on OKX it stands at 1.81. This signals the return of aggressive long positions on various exchanges. However, overly heavy positioning on one side often triggers a sharp correction if prices are rejected at resistance levels.
Liquidation is still relatively under control. As of November 24, total liquidations stood at $49.57 million, consisting of $25.82 million of long positions and $23.75 million of short positions. This balanced liquidation indicates a controlled use of leverage, not a panic sell.
Read also: Altcoins Don’t Go Away: 3 Positive Signals Emerge Amid Market Fears!
If ETH manages to break $3,000 with strong volume participation, the increase in open interest will favor the continuation of the trend. But if ETH fails to break through the current level, the dominance of overly crowded long positions could magnify downside volatility.
Volume Profile Shows Critical Levels that Move Prices
The volume profile in the current price range suggests that ETH is bouncing off high-volume nodes in the $2,500-$2,600 range. This is a structural demand zone that has been a buyer’s stronghold several times throughout 2024, and is now being tested again in November 2025.
Above the current price, the next big volume block is in the range of $3,150 to $3,450 – coinciding with the 200-day EMA and the upper limit of the descending channel. Sellers are active in this region and have consistently defended it since October.
Meanwhile, below the $2,500 level, there is no large volume concentration until the $2,050-$2,200 range. This is a deeper correction zone and the base of the previous macro accumulation phase.
This volume distribution confirms the importance of a recovery from the $2,525 level. If this level is broken down again, the liquidity area becomes thin and the price could quickly fall to lower support levels.
Ethereum Prediction: Will ETH Go Up?
ETH’s next big move will largely depend on whether buyers are able to break the descending channel and reclaim the 200-day EMA.
- Bullish Scenario: A close above $2,947 opens the way towards $3,132 (200-day EMA). A breakout above this zone could reverse momentum and open up an upside potential to $3,450 and the upper limit of the channel.
- Bearish Scenario: Rejection at $2,947 or $3,000 area could push the price back down to around $2,760. If the price breaks below $2,525, it will pave the way towards deeper pockets of liquidity in the $2,200 range, signaling a continuation of the macro downtrend.
ETH will only show meaningful gains if it manages to break out of the channel and important EMA zones. Until that happens, the general trend remains defensive heading into December.
FAQ
What is Ethereum (ETH)?
Ethereum (ETH) is a blockchain platform that allows developers to build and run decentralized applications and smart contracts.
Why has the price of Ethereum (ETH) decreased?
The Ethereum (ETH) price experienced a decline as it was within a descending channel that has been directing the decline since September, with sellers continuing to defend the upper boundary of the channel.
What does EMA mean in the context of Ethereum (ETH) trading?
EMA (Exponential Moving Average) is a type of moving average that gives more weight to recent price data and is often used to identify market trends.
That’s the latest information about crypto. Follow us on Google News to get the latest crypto news about crypto projects and blockchain technology. Also, learn crypto from scratch with complete discussion through Pintu Academy and stay up-to-date with the latest crypto market such as bitcoin price today, xrp coin price today, dogecoin and other crypto asset prices through Pintu Market.
Enjoy an easy and secure crypto trading experience by downloading Pintu crypto app via Google Play Store or App Store now. Also, get a web trading experience with various advanced trading tools such as pro charting, various types of order types, and portfolio tracker only at Pintu Pro.
*Disclaimer
This content aims to enrich readers’ information. Pintu collects this information from various relevant sources and is not influenced by outside parties. Note that an asset’s past performance does not determine its projected future performance. Crypto trading activities have high risk and volatility, always do your own research and use cold cash before investing. All activities of buying and selling bitcoin and other crypto asset investments are the responsibility of the reader.
Reference:
- CoinEdition. Ethereum Price Prediction: Can Buyers Break Resistance and Finally Flip the Downtrend. Accessed on November 25, 2025
Latest News
© 2026 PT Pintu Kemana Saja. All Rights Reserved.
The trading of crypto assets is carried out by PT Pintu Kemana Saja, a licensed and regulated Digital Financial Asset Trader supervised by the Financial Services Authority (OJK), and a member of PT Central Finansial X (CFX) and PT Kliring Komoditi Indonesia (KKI). Crypto asset trading is a high-risk activity. PT Pintu Kemana Saja do not provide any investment and/or crypto asset product recommendations. Users are responsible for thoroughly understanding all aspects related to crypto asset trading (including associated risks) and the use of the application. All decisions related to crypto asset and/or crypto asset futures contract trading are made independently by the user.