XRP Price Teeters on the Edge — But On-Chain Data Offers a Glimmer of Hope
Jakarta, Pintu News – XRP has been one of the weakest performing large-cap crypto assets this week. The price of XRP (XRP) is down about 1.1% since yesterday and has slumped nearly 11% in the last seven days. This decline is in line with the chart pattern which shows a strong downward structure.
However, one rare on-chain signal now suggests a change in direction, potentially arresting a deeper decline. These mixed conditions keep the direction of XRP’s movement open, especially since the asset is trading near a crucial decision point.
Breakdown Structure Strengthens as Critical Support Zone Appears
XRP continues to move below the downtrend line. This trendline forms the upper boundary of a large triangle pattern, with the $1.94 level being the base of the pattern. This is a common technical pattern in bearish trends.
Read also: Pi Network Edges Higher as Short-Term Optimism Builds
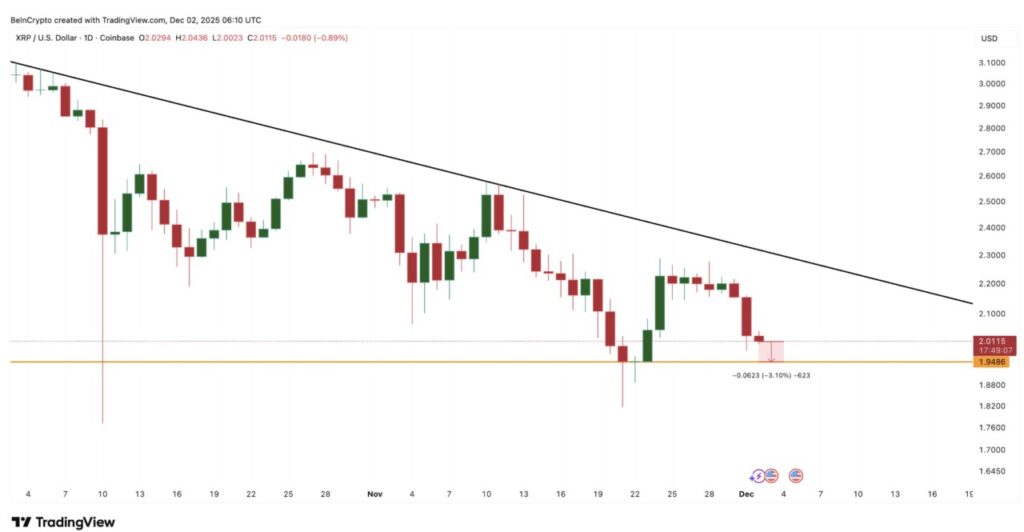
If the price drops below $1.94, it will break the bottom of the declining structure and confirm the potential for further declines. Currently, the XRP price is only about 3% away from that level.
The cost-basis heatmap reinforces the importance of this level. The cost-basis heatmap shows where most tokens were initially purchased. These areas often serve as strong support or resistance.
Currently, the densest cluster is between $1.96 and $1.97, with approximately 1.79 billion XRP in this price range. If the price of XRP drops below $1.96-especially past $1.94-then the entire cluster will be underwater, and this could trigger an even faster price drop towards the next important zone, which is discussed next.
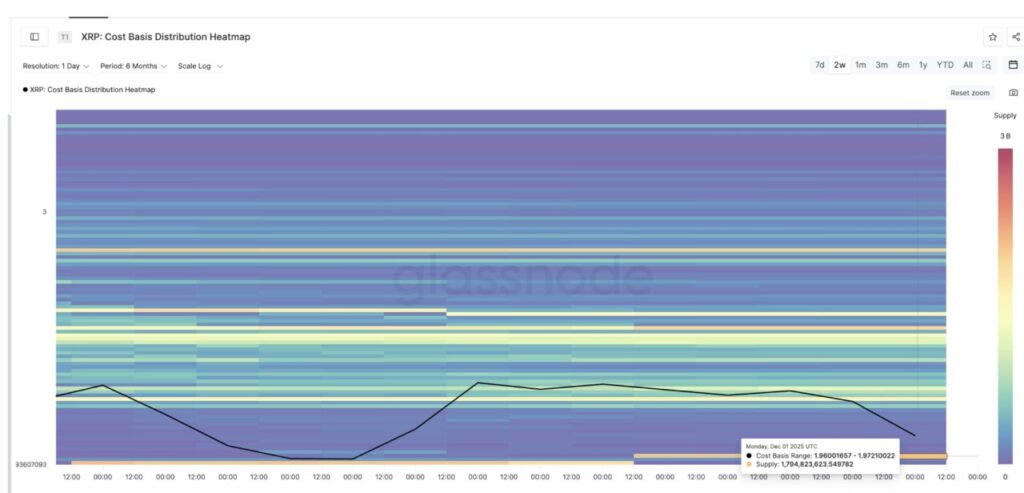
This is the most obvious meeting point between technical analysis and on-chain signals seen on the chart.
Holder Net Position Change Turns Green – Rare Shift After 29 Days
One sudden and rare on-chain shift is now beginning to emerge. The Holder Net Position Change indicator monitors how long-term wallets increase or decrease token holdings.
Red bars indicate they are sending tokens out (distribution), while green bars indicate accumulation. For the 29th consecutive day, this indicator shows red, which means that long-term holders of XRP continue to sell every day.
Read also: Dogecoin Surges 9% Today as Whale Activity Drops Sharply
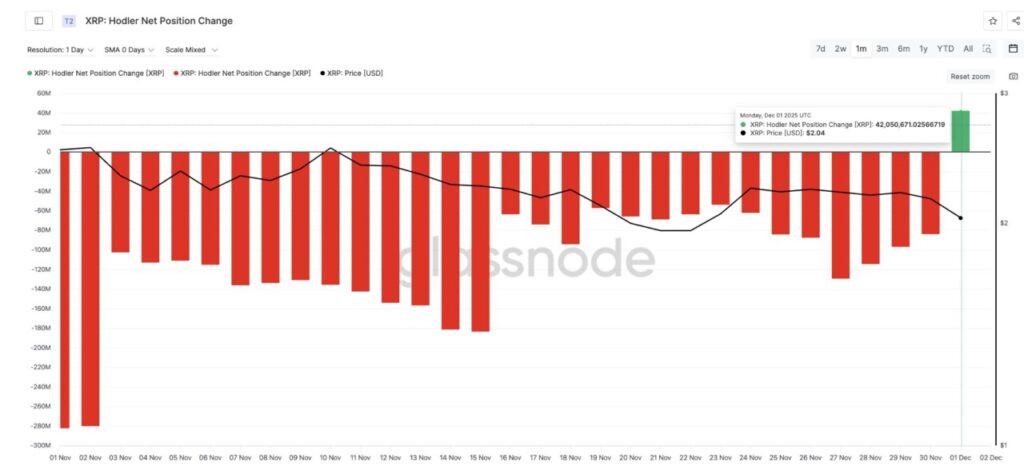
However, on December 1, this indicator turned green for the first time in a month. The numbers reversed from -83.9 million XRP on November 30 to +42.05 million XRP, a drastic change of about 150% from net outflows to net inflows.
This is the first clear sign that long-term investors are starting to respond to the support zone being tested, and may be preparing to attempt a rebound. This is the rare hope that was previously mentioned.
XRP Price Levels: Next Direction Determined by $1.94 Level
As mentioned earlier, XRP is still moving below the downtrend line, which is the upper limit of the triangle pattern. On the other hand, the Fibonacci levels serve as the basis of this structure. The price of XRP has broken several important levels.
The first crucial drop occurred below the 0.5 Fibonacci line, around $2.19, followed by another drop below $2.10. The next key support zone is in the range of $1.99 to $1.94.
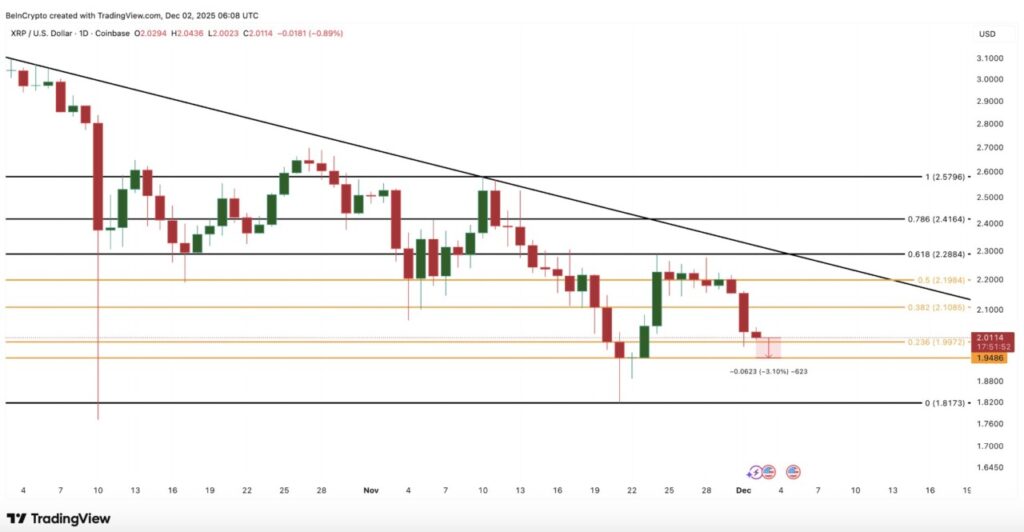
A close below $1.94 would confirm the breakdown of this structure and open the way towards the next support around $1.81, which is considered the next major resistance zone.
However, if long-term holders continue to accumulate, and the cluster between $1.94-$1.97 holds, then there is a chance for XRP to attempt a rebound.
The initial recovery target is at $1.99. The price needs to stay above this level in order to avoid a deeper correction.
Meanwhile, a stronger recovery will only occur if the price of XRP is able to break $2.28, as this is where the price will cross the downtrend line and erase the continuous selling pressure.
Currently, the price of XRP is between the strongest short-term support zone and the downtrend line of resistance. The direction of the next move will largely depend on whether the accumulation from long-term investors is strong enough to prevent a new decline.
That’s the latest information about crypto. Follow us on Google News to get the latest crypto news about crypto projects and blockchain technology. Also, learn crypto from scratch with complete discussion through Pintu Academy and stay up-to-date with the latest crypto market such as bitcoin price today, xrp coin price today, dogecoin and other crypto asset prices through Pintu Market.
Enjoy an easy and secure crypto trading experience by downloading Pintu crypto app via Google Play Store or App Store now. Also, get a web trading experience with various advanced trading tools such as pro charting, various types of order types, and portfolio tracker only at Pintu Pro.
*Disclaimer
This content aims to enrich readers’ information. Pintu collects this information from various relevant sources and is not influenced by outside parties. Note that an asset’s past performance does not determine its projected future performance. Crypto trading activities have high risk and volatility, always do your own research and use cold cash before investing. All activities of buying and selling bitcoin and other crypto asset investments are the responsibility of the reader.
Reference:
- BeInCrypto. XRP Price: Rare Bullish Signal, Breakdown Risk. Accessed on December 3, 2025
Latest News
© 2026 PT Pintu Kemana Saja. All Rights Reserved.
The trading of crypto assets is carried out by PT Pintu Kemana Saja, a licensed and regulated Digital Financial Asset Trader supervised by the Financial Services Authority (OJK), and a member of PT Central Finansial X (CFX) and PT Kliring Komoditi Indonesia (KKI). Crypto asset trading is a high-risk activity. PT Pintu Kemana Saja do not provide any investment and/or crypto asset product recommendations. Users are responsible for thoroughly understanding all aspects related to crypto asset trading (including associated risks) and the use of the application. All decisions related to crypto asset and/or crypto asset futures contract trading are made independently by the user.