Antam Gold Price Chart Today December 8, 2025: Up or Down?
Jakarta, Pintu News – Gold prices are back in the spotlight ahead of year-end, especially after global markets showed volatility throughout November to early December.
Based on the latest data from HargaEmas.com, the movement of world gold prices and Antam gold today shows interesting dynamics, both for short-term investors and long-term asset savers. This article summarizes the development of spot gold prices, daily movement charts, and Antam gold trends from November 24 to December 8, 2025.
December 8, 2025 Spot Gold Price: Modest Rise across All Metrics
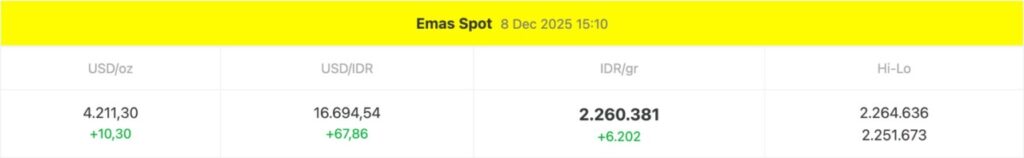
Spot gold price data as of December 8, 2025 at 15:10 WIB shows a moderate increase:
- World gold price (USD/oz): 4.211,30
Up +10.30 from the previous session. - USD/IDR rate: 16.694,54
Strengthened +67.86. - Spot gold price in rupiah per gram: 2.260.381
Increase of +6,202. - Price range (Hi-Lo): 2.264.636 – 2.251.673
The rise in spot gold prices is indicative of strengthening global demand, mainly due to macro factors such as economic uncertainty, interest rate fluctuations, as well as the weakening of the dollar index which encourages investors to return to hedge assets.
Also Read: 5 Important Facts from Bitcoin’s (BTC) Latest Prediction: US$125,000 Target?
World Gold Chart in Rupiah: Stable but Volatile Daily Movement
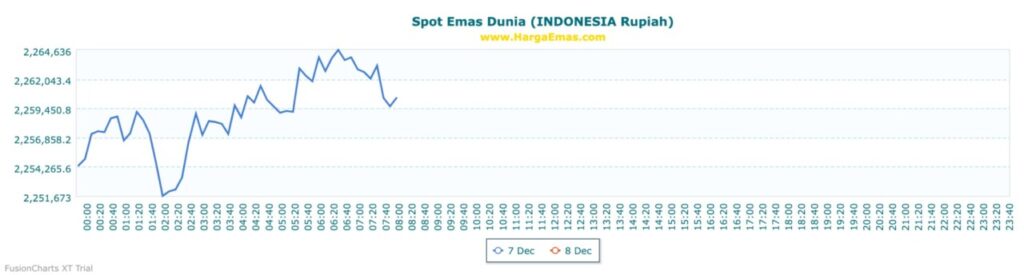
The world gold spot chart (IDR) shows a pattern of intraday volatility throughout December 8.
Some key points seen on the chart:
- The price was at its lowest point around 2,251,673 in the early hours of the morning.
- After that, the price moved up to the range of 2,262,000 – 2,264,000 at 06:00-07:00 WIB.
- Towards noon, the price corrected slightly again but remained stable in the 2,259,000 – 2,260,000 area.
The price fluctuations reflect the fact that the global gold market is sensitive to economic data and fast-changing market sentiment.
Antam Gold Price Chart: November 24 – December 8, 2025 Trend
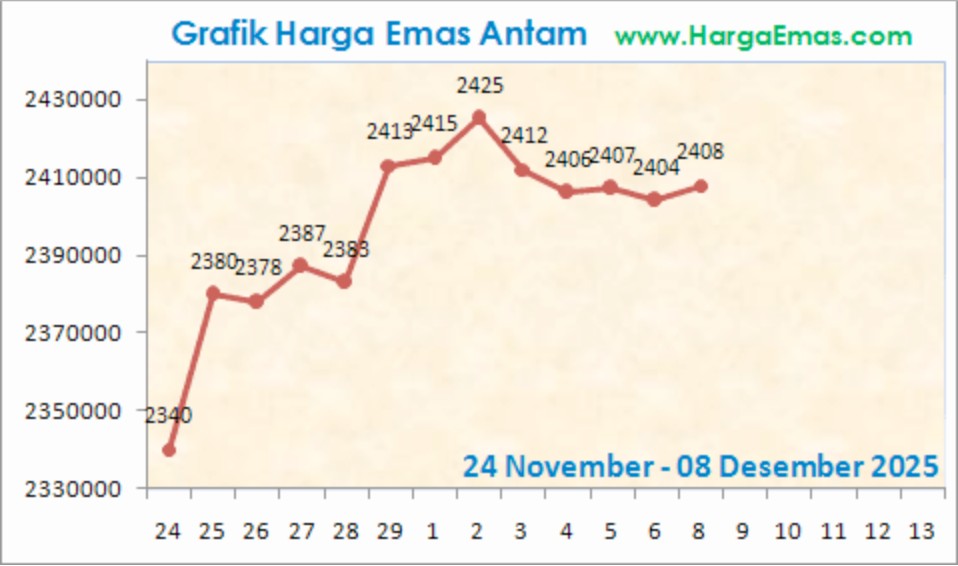
Based on the Antam gold chart displayed by HargaEmas.com, there have been several important phases over the past two weeks:
- November 24: The price was at 2,340,000, being the starting point of consolidation.
- November 25-27: Significant rise towards the range of 2,378,000 – 2,387,000.
- December 1-2: Gold breaks the highest level of the period at 2,425,000.
- December 3-7: Periodic decline towards 2,404,000 – 2,407,000.
- December 8: The price rebounded to 2,408,000.
The chart shows a strong uptrend in late November, followed by consolidation and mild correction in early December. The December 8 rise shows the potential for recovery towards the psychological level of 2,420,000 if global momentum returns.
Gold Prices Strengthen, Potential Consolidation Continues
Overall, today’s gold price shows:
- Slight but steady gains in spot gold.
- Moderately intense intraday volatility on the rupiah chart.
- Antam gold showed a rebound pattern after a short correction for several days.
If global trends remain favorable – such as stable interest rates and a weakening dollar – gold prices could potentially return to near late-November consolidation levels. However, investors still need to pay close attention to macro dynamics and US economic data as they greatly influence the direction of gold prices in the short term.
Also Read: 10 Ways to Learn Crypto from Zero: Basic Guide to Start Investing Safely
Follow us on Google News to get the latest information about crypto and blockchain technology. Check Bitcoin price today, Solana price today, Pepe coin and other crypto asset prices through Pintu Market.
Enjoy an easy and secure crypto trading experience by downloading Pintu crypto app via Google Play Store or App Store now. Also, get a web trading experience with various advanced trading tools such as pro charting, various types of order types, and portfolio tracker only at Pintu Pro.
*Disclaimer
This content aims to enrich readers’ information. Pintu collects this information from various relevant sources and is not influenced by outside parties. Note that an asset’s past performance does not determine its projected future performance. Crypto trading activities are subject to high risk and volatility, always do your own research and use cold hard cash before investing. All activities of buying andselling Bitcoin and other crypto asset investments are the responsibility of the reader.
FAQ
What caused the spot gold price to rise on December 8, 2025?
The increase in spot gold prices by +10.30 USD/oz was driven by strengthening global demand and a weakening dollar index. Data from HargaEmas.com shows the strengthening of the USD/IDR exchange rate which also affects the price of gold in rupiah.
Why does the world gold chart show intraday volatility?
The volatile intraday movement was triggered by the market’s quick reaction to changes in global economic sentiment. Price data showed a range of movement from IDR 2,251,673 to IDR 2,264,636 per gram throughout the day.
What is the trend of Antam gold prices in the last two weeks?
The chart records a strong rise from 2,340,000 on November 24 to a peak of 2,425,000 in early December. After a gradual correction, the price rallied back to 2,408,000 on December 8.
Is the current Antam gold price in an upward or downward trend?
The data showed a consolidation pattern after a strong uptrend in late November. Mild strengthening on December 8 indicates a potential recovery, although global conditions remain a key deciding factor.
What global factors are affecting gold prices the most today?
Key factors include US monetary policy, sentiment towards inflation, and US dollar movements. Global uncertainty usually increases interest in hedge assets such as gold.
Does today’s rise in gold prices mark the beginning of a new bullish trend?
Based on the chart, the current rise reflects more of a short-term rebound after a correction throughout early December. Confirmation of the bullish trend requires a sustained strengthening above the 2,420,000 level.
Why does the USD/IDR exchange rate affect the price of gold in rupiah?
Gold is traded in US dollars, so a strengthening or weakening of the USD/IDR exchange rate directly changes the rupiah value per gram. The rate of 16,694.54 on December 8 also increased the domestic gold price.
Reference
- HargaEmas.com. Spot Gold Price Data and Antam Gold Chart. Accessed on December 8, 2025.
Latest News
© 2026 PT Pintu Kemana Saja. All Rights Reserved.
The trading of crypto assets is carried out by PT Pintu Kemana Saja, a licensed and regulated Digital Financial Asset Trader supervised by the Financial Services Authority (OJK), and a member of PT Central Finansial X (CFX) and PT Kliring Komoditi Indonesia (KKI). Crypto asset trading is a high-risk activity. PT Pintu Kemana Saja do not provide any investment and/or crypto asset product recommendations. Users are responsible for thoroughly understanding all aspects related to crypto asset trading (including associated risks) and the use of the application. All decisions related to crypto asset and/or crypto asset futures contract trading are made independently by the user.