5 Reasons Ethereum (ETH) Surged and Left Bitcoin (BTC) in a New Bullish Trend
Jakarta, Pintu News – In the past few days, Ethereum (ETH) has recorded a significant surge that has put it well ahead of Bitcoin (BTC). This strengthening is not just a price increase, but also a signal that Ethereum is back in the market limelight with stronger bullish potential.
1. ETH Breaks Many Important Resistance Levels
Ethereum managed to maintain its position above $3,000 and quickly broke through resistance levels of $3,120, $3,250, and $3,350. In fact, ETH even reached a new local peak of $3,396 before entering a consolidation phase.
This consecutive breakout confirms that buying pressure is dominant, while Bitcoin lags behind without a similar move. Stability above the 100 hourly SMA also confirms that the bullish trend is still firm.
Also Read: Will Dogecoin (DOGE) be back in the hands of the bulls by early 2026?
2. Bullish Structure Strengthens with Solid Trend Support
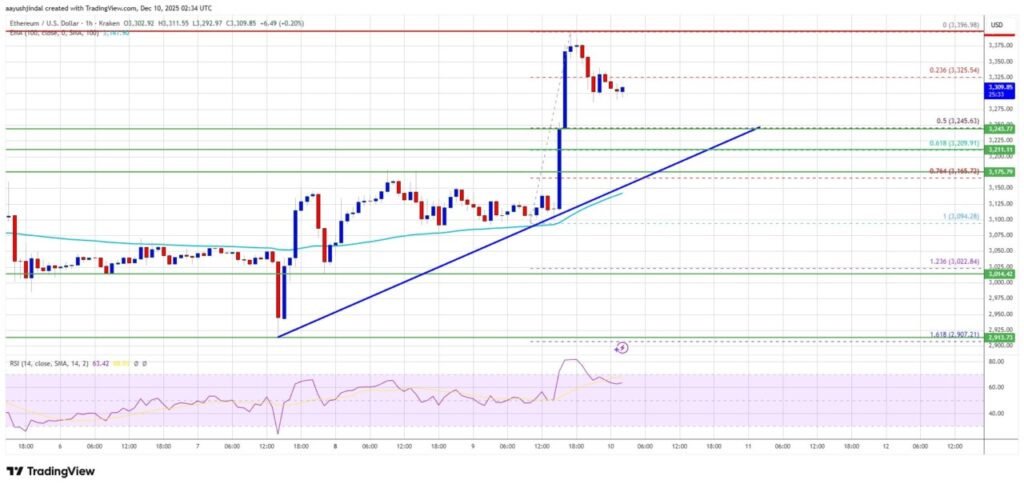
The hourly chart of ETH/USD shows a strong bullish trend line with important support at $3,210. If Ethereum maintains the zone, the chances of another upside increase.
The nearest resistance level is at $3,320, followed by $3,350 and $3,380 as crucial points that could determine whether ETH will continue its rally.
3. Breakout Chance to $3,500 Wide Open
If Ethereum manages to surpass the strong resistance at $3,380, bullish momentum is expected to trigger an advance to $3,420.
A break of the $3,420 level will pave the way for higher targets of $3,500 and even up to $3,550 in the next few days. These levels are the main focus for traders looking to continue the short-term bullish trend.
4. Downside Risk Remains, but Measurable
If ETH fails to hold above $3,380, a potential correction could emerge. Initial support is at $3,250 as well as the 50% Fibonacci retracement level of the $3,094-$3,396 move.
The next major support is at $3,210. If broken, ETH could be pressured towards $3,150 or even $3,050. But so far, the general trend is still in favor of bullish opportunities.
5. Technical Indicators Confirm Bullish Momentum
Technical indicators such as the hourly MACD showed an increase in positive momentum, while the hourly RSI held above neutral levels, signaling a strong buying impulse.
This combination of indicators reinforces the projection that Ethereum still has room to continue rising in the near future.
Conclusion
With a series of breakouts and technical indicators still favoring the bulls, Ethereum is now strategically positioned to lead the next bullish wave. Key resistance and support levels will factor into the direction of the crypto market in the next few days.
Also Read:Michael Saylor Signaled New Bitcoin Purchases, BTC Price Ready to Skyrocket?
Follow us on Google News to get the latest information about crypto and blockchain technology. Check Bitcoin price today, Solana price today, Pepe coin and other crypto asset prices through Pintu Market.
Enjoy an easy and secure crypto trading experience by downloading Pintu crypto app via Google Play Store or App Store now. Also, get a web trading experience with various advanced trading tools such as pro charting, various types of order types, and portfolio tracker only at Pintu Pro.
*Disclaimer
This content aims to enrich readers’ information. Pintu collects this information from various relevant sources and is not influenced by outside parties. Note that an asset’s past performance does not determine its projected future performance. Crypto trading activities are subject to high risk and volatility, always do your own research and use cold hard cash before investing. All activities of buying andselling Bitcoin and other crypto asset investments are the responsibility of the reader.
FAQ
What was the most recent high price Ethereum reached?
Ethereum reached a local peak at $3,396 before entering a consolidation phase.
Which resistance levels do ETH traders need to pay attention to?
Key resistances are at $3,320, $3,350, and $3,380. A break above $3,380 could trigger further gains.
What are the risks if Ethereum fails to break the $3,380 resistance?
If it fails, the price could correct towards $3,250, then $3,210 as the main support, potentially even down to $3,150.
What technical indicators support Ethereum’s bullish trend?
The hourly MACD and hourly RSI are both showing strong bullish momentum, supporting continued upside potential.
How high can Ethereum go in the short term?
If ETH breaks $3,420, the price could potentially move towards $3,500 to $3,550.
Reference
- NewsBTC. Ethereum Smashes Resistance at $3,200, What Could Trigger More Upsides?. Accessed on December 10, 2025
Latest News
© 2026 PT Pintu Kemana Saja. All Rights Reserved.
The trading of crypto assets is carried out by PT Pintu Kemana Saja, a licensed and regulated Digital Financial Asset Trader supervised by the Financial Services Authority (OJK), and a member of PT Central Finansial X (CFX) and PT Kliring Komoditi Indonesia (KKI). Crypto asset trading is a high-risk activity. PT Pintu Kemana Saja do not provide any investment and/or crypto asset product recommendations. Users are responsible for thoroughly understanding all aspects related to crypto asset trading (including associated risks) and the use of the application. All decisions related to crypto asset and/or crypto asset futures contract trading are made independently by the user.