BTC Price Update Today (12/15): At Risk of a 3% Correction? Bollinger Bands Signal Triggers Caution
Jakarta, Pintu News – As another week ends in December, Bitcoin (BTC) seems to be one of the less promising trades. This is not due to macroeconomic factors or recent news, but rather the closing position of the daily candle on the TradingView chart.
Close Below the Bollinger Bands Centerline
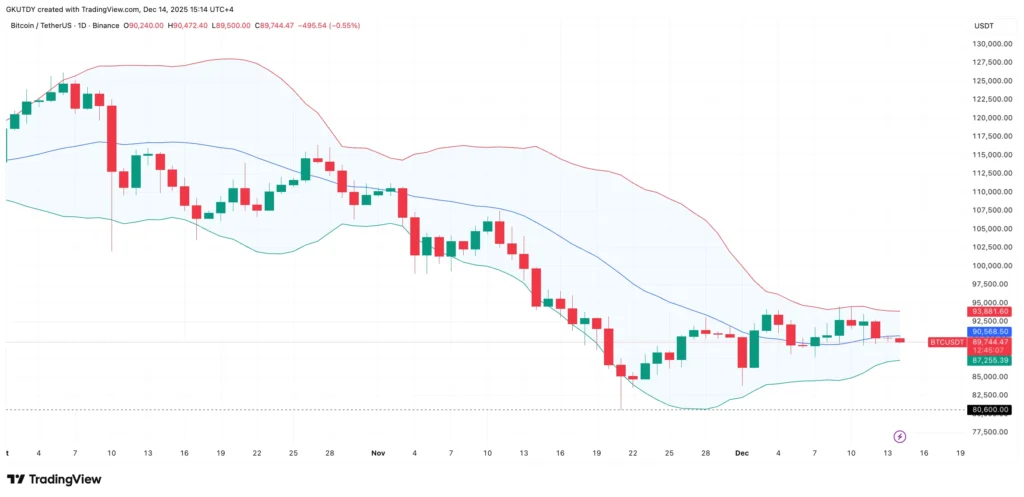
Currently, Bitcoin (BTC) is closing the day below the middle line of the Bollinger Bands, which is around the $90,500 area. This detail is quietly changing the market bias. As long as the daily close is above that line, the price tends to gravitate towards the lower band, which is currently at $87,250. This represents a drop of almost 3% from current levels.
The More Complicated Crypto Market Context
Bitcoin (BTC) experienced a rapid rise earlier, bypassing many structures that should have been built gradually. The $90,000 to $100,000 zone was simply bypassed without proper development. When Bitcoin (BTC) price loses the daily middle band, the bypassed area no longer serves as support, but instead becomes like open air.
Also read: Pi Network Price Update Today (15/12): Down 2.41%, Double-Top Pattern Formed?
Don’t be fooled by Bitcoin’s tranquility?
According to U Today, the current seemingly calm market conditions could potentially give false signals. It is possible that Bitcoin (BTC) may still experience a further correction of around 3% to test buying interest in the lower area of the price range.
This situation does not necessarily indicate that Bitcoin is in trouble. However, at current price levels, the risk of purchase is considered relatively higher than the potential return.
As long as the price has not been able to close daily trading above the middle band of the technical indicators, the pressure is expected to continue, in line with the calculation of the indicators used.
Conclusion
Investors and traders should conduct careful analysis before deciding to buy Bitcoin (BTC) under current market conditions. Understanding indicators such as Bollinger Bands can provide important insights into potential future price movements.
FAQ
What are Bollinger Bands?
Bollinger Bands is a technical analysis tool that consists of three lines that depict the standard deviation of the average price. The center line is usually a simple moving average, while the other two lines are standard deviations from the center line.
Why is closing below the center line of the Bollinger Bands significant?
A close below the center line of the Bollinger Bands indicates a potential change in market bias from bullish to bearish, which could mean that prices will tend to drop towards the lower band.
What is the current price of the lower band of Bollinger Bands for Bitcoin?
The lower band of the Bollinger Bands for Bitcoin (BTC) is currently at $87,250, which indicates a potential price drop of about 3% from current levels.
What is the impact of jumping the price structure on Bitcoin?
Jumping over the price structure without establishing strong support at certain levels may result in the area not functioning as support when the price drops back down, increasing the risk of further declines.
Is buying Bitcoin at this time advisable?
Based on the Bollinger Bands analysis, buying Bitcoin (BTC) right now may be more risky and likely to result in losses rather than gains, especially if the price does not return above the center line of the Bollinger Bands.
That’s the latest information about crypto. Follow us on Google News to get the latest crypto news about crypto projects and blockchain technology. Also, learn crypto from scratch with complete discussion through Pintu Academy and stay up-to-date with the latest crypto market such as bitcoin price today, xrp coin price today, dogecoin and other crypto asset prices through Pintu Market.
Enjoy an easy and secure crypto trading experience by downloading Pintu crypto app via Google Play Store or App Store now. Also, get a web trading experience with various advanced trading tools such as pro charting, various types of order types, and portfolio tracker only at Pintu Pro.
*Disclaimer
This content aims to enrich readers’ information. Pintu collects this information from various relevant sources and is not influenced by outside parties. Note that an asset’s past performance does not determine its projected future performance. Trading crypto carries high risk and volatility, always do your own research and use cold hard cash before investing. All activities of buying and selling bitcoin and other crypto asset investments are the responsibility of the reader.
Reference
- U.Today. Bitcoin Buyers Face Warning Signal from Bollinger Bands. Accessed on December 15, 2025
- Featured Image: Generated by AI
Latest News
© 2026 PT Pintu Kemana Saja. All Rights Reserved.
The trading of crypto assets is carried out by PT Pintu Kemana Saja, a licensed and regulated Digital Financial Asset Trader supervised by the Financial Services Authority (OJK), and a member of PT Central Finansial X (CFX) and PT Kliring Komoditi Indonesia (KKI). Crypto asset trading is a high-risk activity. PT Pintu Kemana Saja do not provide any investment and/or crypto asset product recommendations. Users are responsible for thoroughly understanding all aspects related to crypto asset trading (including associated risks) and the use of the application. All decisions related to crypto asset and/or crypto asset futures contract trading are made independently by the user.