HBAR’s Last Bullish Hope: Can It Escape a 13% Drop?
Jakarta, Pintu News – Reporting from BeInCrypto (12/14), HBAR is starting to show signs of weakening. The token fell nearly 2% in 24 hours and is approaching a 10% drop in a week. Throughout this decline, the HBAR price has broken several short-term support levels and is now around $0.12.
This level is crucial. HBAR is only about 1% above the breakdown zone which could push the price down to around $0.10. If that happens, the drop from current levels could be as much as 12% to 13%.
However, there is still one bullish signal keeping the price structure afloat. If this signal fails to hold, the downward pressure could accelerate and deepen.
Big Capital Starts to Stay Away, Structure Gets Weaker
The main source of pressure on Hedera (HBAR) comes from the behavior of large holders (whales) who are starting to pull out. This can be seen through the Chaikin Money Flow (CMF) indicator, which measures whether large funds are moving in or out of an asset by combining price movements and trading volume.
Read also: Chainlink Sees Strong Accumulation, But LINK Price Fails to Respond – Why?
When the CMF is above zero, it means that big buyers are still active. But if the CMF falls below zero, it signals a distribution or sell-off from big players.
For HBAR, CMF has seen a sharp decline. Since December 7, it has plummeted more than 400% and gone deep into negative territory. In the previous downturn, CMF still stayed in the positive zone, which meant that the selling pressure could still be absorbed by buyers. But this time, that support disappeared.
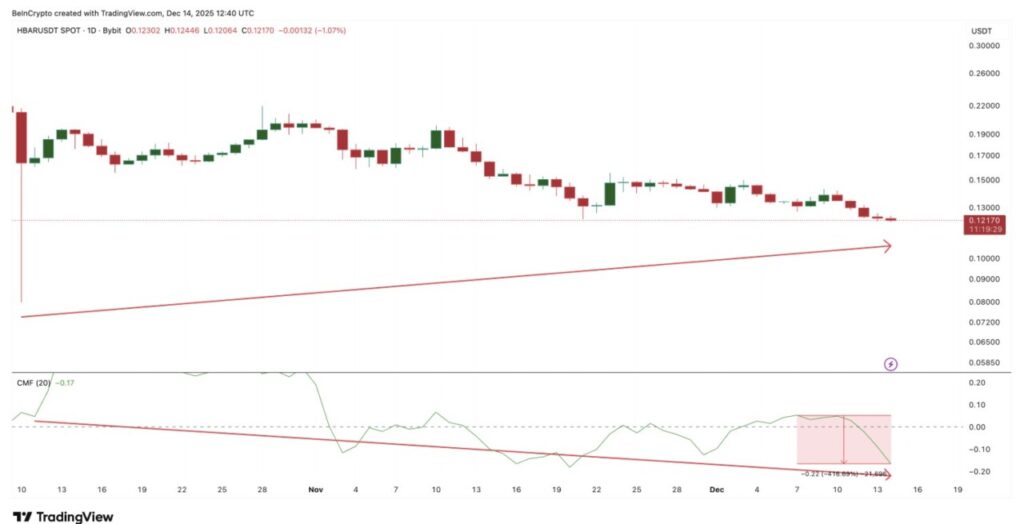
In addition, there was a clear bearish divergence. Between October 10 and December 14, HBAR prices formed higher lows, while CMF formed lower lows (indicating stronger selling pressure). This suggests that the recent price stability is not supported by buying interest from large investors.
In simple terms, the HBAR price appears to be trying to hold on, while large funds are quietly exiting the market. This imbalance makes the HBAR price even more vulnerable to downside.
One Bullish Signal Still Holding the Price
Despite the pressure from large investors starting to move away, there is still one momentum indicator that is giving a bullish signal.
The indicator is the Relative Strength Index (RSI), which measures the strength and speed of price movements in the short term. The RSI is useful for identifying whether selling pressure is starting to weaken. An RSI reading close to 30 usually signals an oversold condition.
On the daily chart of HBAR, the RSI formed a bullish divergence. Between November 21 and December 14, the HBAR price printed lower lows, while the RSI printed higher lows (a sign of weakening selling pressure). This is a classic pattern of bullish divergence, which often signals a potential trend reversal.
It is worth noting, in the past 3-month period, the price of HBAR is still in a clear downtrend, with a decline of more than 48%.
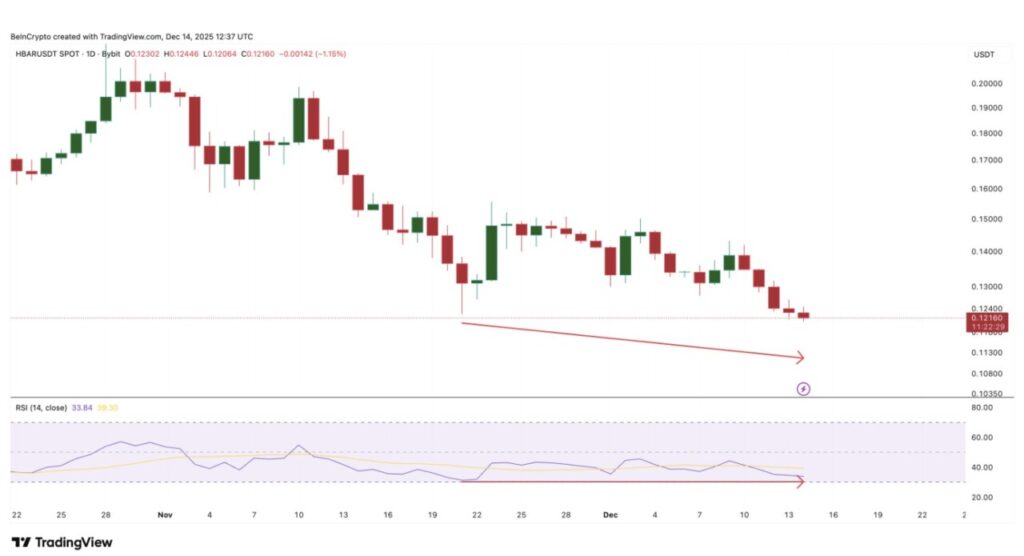
This shows that although prices continue to decline, the strength of the sellers is slowly weakening. The selling pressure remains, but the momentum is diminishing. Currently, the RSI divergence is the only bullish signal left for HBAR.
Read also: Solana Price Drops to 6-Month Low as Crypto Whales Begin Accumulating SOL
HBAR: Continue Down or Start Reversing?
The direction in which the price moves will determine the final outcome. Currently, HBAR is trading below thedescending trendline that has held back any rallies over the past few weeks. At the same time, the price is testing Fibonacci-based support around $0.12.
This area is the lower limit of thedescending triangle pattern, where the horizontal support line at $0.12 becomes the last floor and the downtrend line becomes the roof of the pattern.
If the support at $0.12 is broken strongly, the next target is around $0.10. A drop to that level would confirm a 12%-13% breakdown and extend the bearish trend.
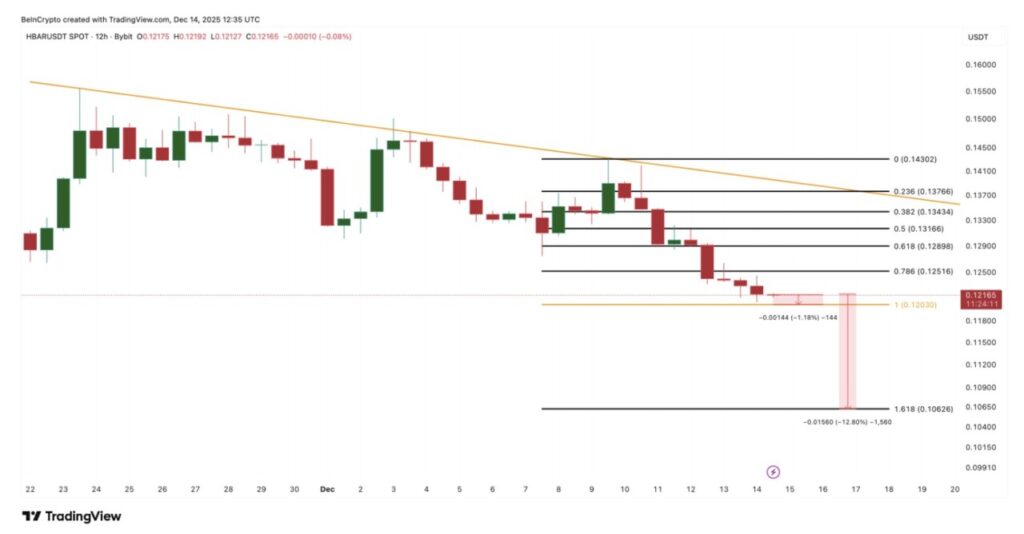
To break this negative trend, HBAR needs to get back above the $0.13 level. This level aligns with an important Fibonacci retracement zone, and is a sign that buyers are starting to re-enter the market.
A stronger trend change will only occur if the price manages to break above $0.13 and break out of the bearish pattern. That would change the price structure from bearish to neutral.
FAQ
What is Hedera Hashgraph (HBAR)?
Hedera Hashgraph (HBAR) is a distributed ledger platform that uses hashgraph technology to provide services such as cryptocurrency, smart contracts, and file storage at a higher speed and scale than traditional blockchains.
What is Chaikin Money Flow (CMF)?
Chaikin Money Flow (CMF) is an indicator that measures the flow of money in or out of an asset by combining price movement with trading volume.
What is the Relative Strength Index (RSI)?
The Relative Strength Index (RSI) is a momentum indicator used in technical analysis to measure the speed and change of an asset’s price movement, helping to identify overbought or oversold conditions.
That’s the latest information about crypto. Follow us on Google News to get the latest crypto news about crypto projects and blockchain technology. Also, learn crypto from scratch with complete discussion through Pintu Academy and stay up-to-date with the latest crypto market such as bitcoin price today, xrp coin price today, dogecoin and other crypto asset prices through Pintu Market.
Enjoy an easy and secure crypto trading experience by downloading Pintu crypto app via Google Play Store or App Store now. Also, get a web trading experience with various advanced trading tools such as pro charting, various types of order types, and portfolio tracker only at Pintu Pro.
*Disclaimer
This content aims to enrich readers’ information. Pintu collects this information from various relevant sources and is not influenced by outside parties. Note that an asset’s past performance does not determine its projected future performance. Crypto trading activities have high risk and volatility, always do your own research and use cold cash before investing. All activities of buying and selling bitcoin and other crypto asset investments are the responsibility of the reader.
Reference:
- BeInCrypto. HBAR Price: One Bullish Signal and Breakdown Risk. Accessed on December 15, 2025
Latest News
© 2026 PT Pintu Kemana Saja. All Rights Reserved.
The trading of crypto assets is carried out by PT Pintu Kemana Saja, a licensed and regulated Digital Financial Asset Trader supervised by the Financial Services Authority (OJK), and a member of PT Central Finansial X (CFX) and PT Kliring Komoditi Indonesia (KKI). Crypto asset trading is a high-risk activity. PT Pintu Kemana Saja do not provide any investment and/or crypto asset product recommendations. Users are responsible for thoroughly understanding all aspects related to crypto asset trading (including associated risks) and the use of the application. All decisions related to crypto asset and/or crypto asset futures contract trading are made independently by the user.