Shiba Inu Plummets 66% and Signals Serious Problems – SHIB’s Downward Trend Continues?
Jakarta, Pintu News – The Shiba Inu (SHIB) is showing more and more signs of structural weakness as the long-lasting downward trend deepens.
While the rest of the memecoin market experienced a brief rally, SHIB failed to share in the gains. Instead, capital flows continue to exit the token. At the time of writing, the SHIB price hovers around $0.0000078 – down about 66% since the start of the year.
This prolonged decline reflects diminishing speculative interest and increasing selling pressure, placing SHIB among the weakest performing memecoin assets, while bearish momentum still dominates.
So, what’s next for this cryptocurrency?
Shiba Inu fails to stop selling pressure
On the 4-hour chart (22/12), the Bull Bear Power (BBP) indicator confirms a bearish market structure. It remains below the zero line and continues to print consecutive red histogram bars – a sign that the sellers still control the market momentum.
Read also: Dogecoin Price Hovers at $0.13 Level Today: DOGE Hints at Potential Rebound
The absence of a meaningful bullish crossover sign indicates that the selling pressure has not eased significantly.
This view is also reinforced by the Money Flow Index (MFI). Currently, it stands at 33.76, well below the neutral level of 50, signaling weak capital inflows as well as continued distribution (sales).
Although the MFI recovered slightly from its oversold position, the indicator has yet to return to bullish territory, indicating low conviction on the part of buyers. In terms of price structure, SHIB is still trading below the previous support level around $0.0000075, which has now turned into a resistance level.
Repeated rejections in this area indicate that supply pressure continues to persist on top of prices, signaling that any attempts at price increases are corrective in nature and not yet strong enough to reverse the main trend.
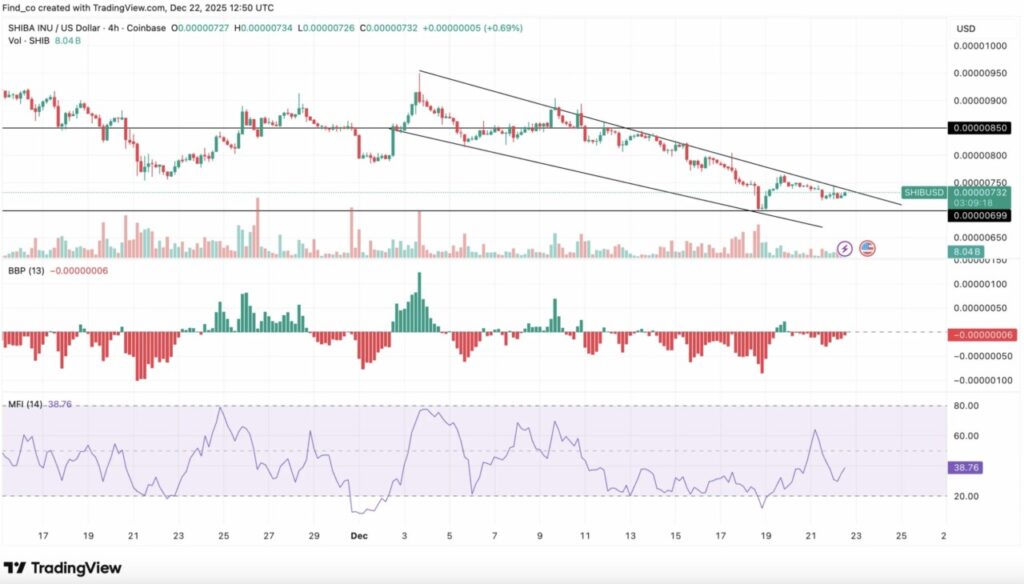
If the selling pressure continues, SHIB price is at risk of dropping towards the $0.0000066 to $0.0000070 support area. Should the price break below this range, the token could potentially face further downside and extend the overall bearish market structure.
SHIB Price Analysis: No Clear Signs of Recovery
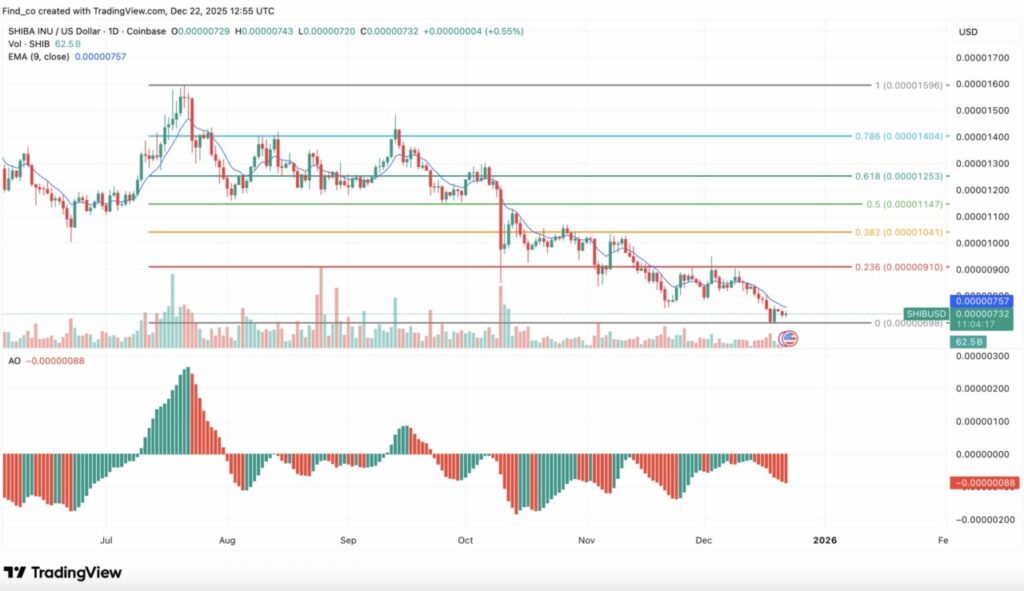
On the daily timeframe, SHIB is still moving inside a descending channel characterized by a pattern of lower highs and lower lows – a classic signal of a continuing downward trend.
Moreover, any short-term rebound consistently stalled near the upper boundary of the channel, confirming the dominance of bearish pressure. Adding further pressure, the 20-day Exponential Moving Average (EMA) remains above the prices, acting as a dynamic resistance.
Every time the price tries to break back through this level, the selling pressure increases again, so the price movement of SHIB remains restrained and the upside potential is difficult to continue.
The momentum indicators also support this view. The Awesome Oscillator (AO) is still in negative territory and continues to print repeated red histogram bars. This suggests that the bearish momentum is still strong, and there are no convincing signs that the buyers are starting to take control.
Read also: Bitcoin Price Held at $88,000 Today: Can BTC Break the $89,000 Wall?
What to Expect Next
Fibonacci retracement levels help give an idea of the next potential price movement. Currently, the price of SHIB is moving close to the Fibonacci level around $0.0000073.
If the price fails to hold at the support area around $0.0000069, selling pressure could escalate faster and potentially trigger a deeper drop. Conversely, if SHIB manages to hold the current support level, it could trigger a short-term rebound.
In that scenario, SHIB might attempt a recovery towards the first resistance level at 0.236 Fibonacci, which is around $0.0000091.
That’s the latest information about crypto. Follow us on Google News to get the latest crypto news about crypto projects and blockchain technology. Also, learn crypto from scratch with complete discussion through Pintu Academy and stay up-to-date with the latest crypto market such as bitcoin price today, xrp coin price today, dogecoin and other crypto asset prices through Pintu Market.
Enjoy an easy and secure crypto trading experience by downloading Pintu crypto app through Google Play Store or App Store now. Also, get a web trading experience with various advanced trading tools such as pro charting, various types of order types, and portfolio tracker only at Pintu Pro.
*Disclaimer
This content aims to enrich readers’ information. Pintu collects this information from various relevant sources and is not influenced by outside parties. Note that an asset’s past performance does not determine its projected future performance. Crypto trading activities have high risk and volatility, always do your own research and use cold cash before investing. All activities of buying and selling bitcoin and other crypto asset investments are the responsibility of the reader.
Reference:
- CCN. Shiba Inu’s (SHIB) 66% Price Collapse Signals Trouble – Downtrend Likely to Continue. Accessed on December 23, 2025
Latest News
© 2026 PT Pintu Kemana Saja. All Rights Reserved.
The trading of crypto assets is carried out by PT Pintu Kemana Saja, a licensed and regulated Digital Financial Asset Trader supervised by the Financial Services Authority (OJK), and a member of PT Central Finansial X (CFX) and PT Kliring Komoditi Indonesia (KKI). Crypto asset trading is a high-risk activity. PT Pintu Kemana Saja do not provide any investment and/or crypto asset product recommendations. Users are responsible for thoroughly understanding all aspects related to crypto asset trading (including associated risks) and the use of the application. All decisions related to crypto asset and/or crypto asset futures contract trading are made independently by the user.