7 BTC Facts: Peter Brandt Finds Head-and-Shoulders Pattern as $90K Break Fails to Last
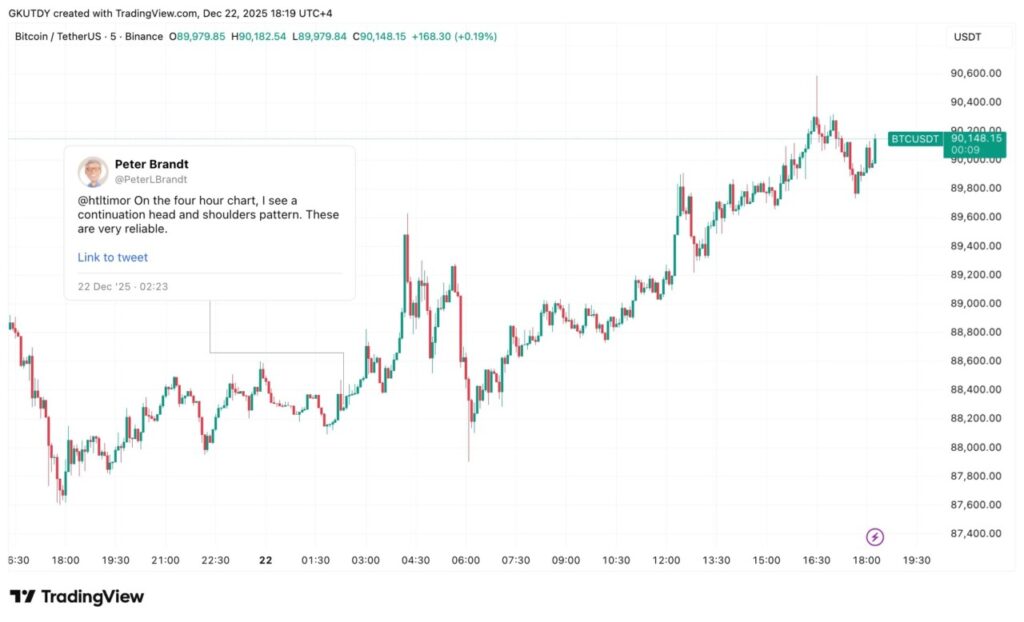
Jakarta, Pintu News – Veteran trader Peter Brandt identified a head-and-shoulders pattern formation on the Bitcoin (BTC) chart, after BTC failed to hold the resistance level of around $90,000 in the latest price movement.
This pattern is considered “highly reliable” by Brandt in the context of short-term technicals and was observed when the BTC price was moving in a consolidation range with an upper limit of around $93,000-$94,000 and a lower limit of around $85,000, according to the analysis published by U.Today. These price movements give an idea of the ongoing technical dynamics in the Bitcoin cryptocurrency market on December 22, 2025.
1. Head-and-Shoulders Pattern Identification by Peter Brandt
Peter Brandt notes that on the four-hour chart Bitcoin forms a head-and-shoulders pattern, a continuation structure that is often used as a technical indicator to assess trend continuation or reversal. Brandt called this pattern “very reliable”, highlighting its historical value in technical analysis even though it does not imply a definitive price prediction.
The head-and-shoulders pattern usually appears after an upward movement when the price fails to create new highs sustainably and may indicate a consolidation phase or downward pressure if the pattern is confirmed.
Also Read: 7 XRP vs BNB Facts: Tight Competition for Top-3 Market-Watched Crypto Positions
2. BTC Fails to Break the $90,000 Level
From the price data at the time of analysis, Bitcoin briefly printed a daily level above $90,000 before dropping back below that mark, indicating that this level did not manage to hold as a strong support level in that time frame. This kind of price movement reflects the market’s uncertainty in maintaining bullish momentum when facing important technical levels.
This kind of price rolling signals that there isn’t enough buyer strength to sustain a breakout at that psychological level in the short term, especially in the context of a consolidating Bitcoin cryptocurrency market.
3. BTC Main Consolidation Range
Brandt also pointed out the price range in which BTC was moving at the time: resistance around $93,000-$94,000 and support around $85,000. These ranges depict a market structure with clear boundaries, so a retest of the middle area of the range or a breakout beyond these boundaries becomes the next important indicator.
Consolidation range analysis is often used by market participants to assess whether the price will continue the previous trend or enter a longer sideways phase.
4. Interpretation of Alternative Pricing Patterns
In Brandt’s discussion, there are two interpretations that are considered “quite logical”: BTC may be experiencing a bearish retest after breaking out of an ascending triangle, or it is moving in an accumulation range which means there is no clear dominant trend. Both scenarios give different insights into the next possible price direction.
This kind of technical interpretation helps market participants understand that a failed breakout at a level is not a direct signal of a bearish or bullish trend without additional confirmation from the advanced price structure.
5. BTC Price Action in a 24-Hour Span
BTC’s chart shows mixed price action: initially a quick spike, followed by a drop to around $88,000 and then a recovery towards the weekly closing session that touched above $90,000 before dropping back down. This kind of price pattern reflects the still high volatility in short-term movements.
These price movements contextualize a Bitcoin cryptocurrency market that is still volatile around important technical levels, with the potential for alternating selling or buying pressure from market participants.
6. Erosion Focus & Technical Support
Brandt emphasized that if Bitcoin wants to maintain the breakout structure and strengthen, the price needs to close above the midpoint of the identified consolidation range and start pushing the upper limit of the range again. Otherwise, the head-and-shoulders pattern is likely to play a role in short-term technical signals.
The need to see the price break back out of the middle area of the range provides specific technical benchmarks for market participants monitoring potential changes in price direction.
7. Market Volatility Context
Bitcoin’s failure to sustain a break at key levels such as $90,000 often occurs in markets that are experiencing long-term consolidation without a clear trend direction, as well as when market sentiment is at a crossroads between selling pressure and buying demand. These conditions are common in the cryptocurrency market due to high speculative participation and sensitivity to technical levels.
Understanding technical structures such as consolidation patterns and ranges provides a useful framework for interpreting price action without relying on guesses of long-term market direction.
Follow us on Google News to get the latest information about crypto and blockchain technology. Check Bitcoin price today, Solana price today, Pepe coin and other crypto asset prices through Pintu Market.
Enjoy an easy and secure crypto trading experience by downloading Pintu crypto app via Google Play Store or App Store now. Also, get a web trading experience with various advanced trading tools such as pro charting, various types of order types, and portfolio tracker only at Pintu Pro.
*Disclaimer
This content aims to enrich readers’ information. Pintu collects this information from various relevant sources and is not influenced by outside parties. Note that an asset’s past performance does not determine its projected future performance. Crypto trading activities are subject to high risk and volatility, always do your own research and use cold hard cash before investing. All activities of buying andselling Bitcoin and other crypto asset investments are the responsibility of the reader.
FAQ
What is the head-and-shoulders pattern that Peter Brandt observed?
The head-and-shoulders pattern is a technical structure in which the price forms three peaks with the middle peak higher, which is often considered a signal of trend continuation or reversal depending on confirmation.
Why is $90,000 important in this analysis?
The $90,000 level is a technical psychological point that BTC briefly reached before failing to hold, an indicator of the market’s inability to sustain the breakout of important levels.
What does the $85,000-$94,000 range mean?
This range depicts the major support and resistance boundaries in the current price structure, providing a context for market consolidation.
Does the pattern mean a definite bearish trend?
No; this pattern shows a short-term technical structure, and confirmation of a breakout or breakdown is required to assess further trend direction.
Who is Peter Brandt?
Peter Brandt is a veteran trader known for technical analysis of commodity and digital asset markets, often sharing his technical insights through charts.
Reference:
Gamza Khanzadaev/U.Today. Legendary Trader Peter Brandt Spots ‘Very Reliable’ Bitcoin Pattern as $90,000 Break Fails to Hold. Accessed December 22, 2025.
Latest News
© 2026 PT Pintu Kemana Saja. All Rights Reserved.
The trading of crypto assets is carried out by PT Pintu Kemana Saja, a licensed and regulated Digital Financial Asset Trader supervised by the Financial Services Authority (OJK), and a member of PT Central Finansial X (CFX) and PT Kliring Komoditi Indonesia (KKI). Crypto asset trading is a high-risk activity. PT Pintu Kemana Saja do not provide any investment and/or crypto asset product recommendations. Users are responsible for thoroughly understanding all aspects related to crypto asset trading (including associated risks) and the use of the application. All decisions related to crypto asset and/or crypto asset futures contract trading are made independently by the user.