Solana Price Prediction: SOL Faces Neutral – Bearish Pressure across Key Indicators
Jakarta, Pintu News – Solana’s (SOL) recent price action reflects a market that is still searching for direction after a fairly volatile correction.
On the 4-hour chart (23/12), SOL is trading below several key moving averages, signaling caution from traders. Although the price had a sharp bounce from the $118-$120 zone, further buying interest is still limited.
As a result, the overall market structure still points to a neutral to bearish pattern. Currently, market participants are waiting to see if this consolidation phase will form a solid basis for recovery, or if it will continue the previous downward trend.
Short-term price structure is still fragile
Solana is currently still consolidating around the $124 region, which serves as the closest support area. This zone has so far been able to withstand selling pressure and slow down the downward momentum.
Read also: Shiba Inu Price Prediction: SHIB Thwarts Bullish Signal, Upside Momentum Still Delayed?
However, the price is still moving below the exponential moving average (EMA) 100 and 200, so sellers are still in control technically in the short term.
If SOL loses the $123-$124 area, the downside risks will increase towards $120. A deeper drop could test the $118 level, which is the most recentswing low. If this level also fails to hold, it will likely confirm the continuation of the downtrend.
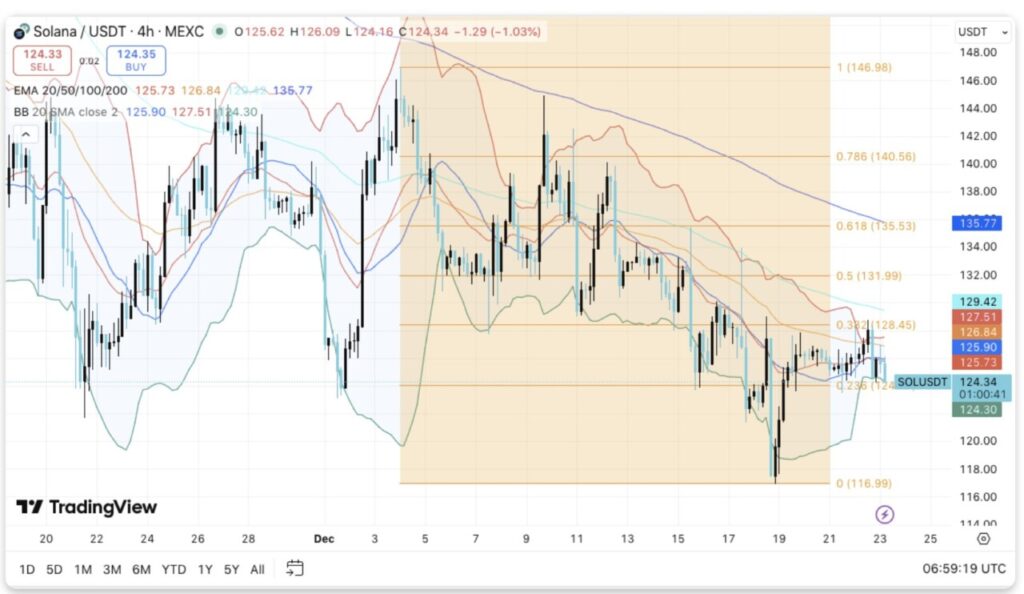
Conversely, a sustained price movement above $128.5 could change the market sentiment. This rise could potentially pave the way towards the $132 area, with stronger resistance around $135.5.
Meanwhile, the Bollinger Bands on the 4-hour chart continue to narrow. This narrowing is usually a sign of a sharp price movement. Therefore, traders expect an expansion of volatility once the price breaks out of the current range.
Open Interest Shows Signs of Market Reset
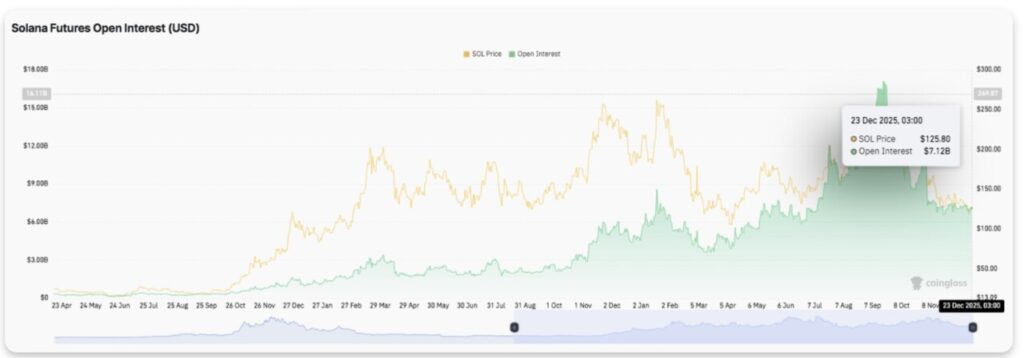
Solana’s futures data shows significant changes in trader behavior. Open interest had risen sharply until mid-2025, as highly leveraged positions increased.
This phase coincided with the price increase, but reflected speculative activity rather than steady demand. Now, open interest has declined to the $7-8 billion range.
This decline signaled a widespread deleveraging process as well as the exit of positions due to liquidation. Interestingly, the price remained stable around $125 during this downward phase. The combination indicates thatweaker hands have exited, and the market is now on a healthier foundation.
Going forward, increased open interest will be an important factor. An increase in open interest accompanied by strengthening prices will indicate renewed confidence in the market. However, a spike in open interest without a price increase should be watched out for as it could signal excessive speculation again.
Spot Flows Reflect Cautious Sentiment
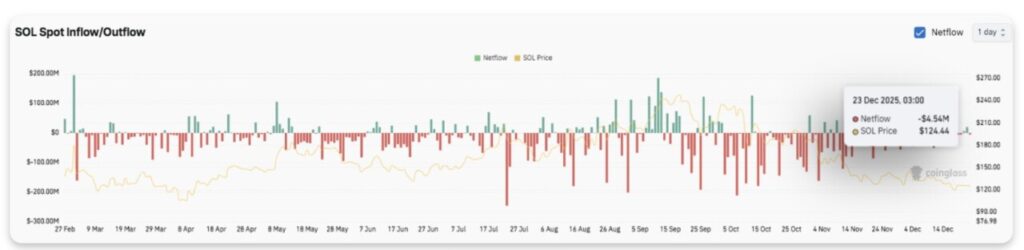
Spot market data shows consistentoutflows. Large spikes of net outflows in red appeared during the heavy selling phase, signaling the distribution that took place in recent months. Meanwhile, brief periods ofinflows failed to sustain momentum as prices attempted to rebound.
Read also: Trump Media Buys $40 Million Worth of Bitcoin, CFTC Chair Prepares Clear Steps for Crypto Rules!
Since October, outflows have dominated daily activity – reflectingprofit-taking and reduced risk appetite. Recently, outflows have started to decline to a moderate level of around $5 million, signaling a weakening of selling pressure.
However, these fund flows are yet to show a strong accumulation phase from market participants.
Solana Price Technical Outlook as Key Levels Narrow Further
Solana’s current price movement is still clearly structured as the market approaches important decision zones. On the 4-hour chart, SOL continues to move in a consolidation phase after bouncing off the $118-$120 support area.
On theupside, resistance levels are now forming a clear ladder of barriers. The closest barriers are at $126.8 and $128.5, where the short-term moving averages and Fibonacci resistances intersect.
If the price manages to break this zone with strong confirmation, the opportunity will open up towards $132.0, followed by a stronger resistance area at $135.5-$136.0. Furthermore, the $140.5 and $147.0 levels are the upper limits on the higher time frames.
On thedownside, the key support area remains in the $124.0-$123.5 range, which is currently the fulcrum of price consolidation. Failure to defend this area is likely to trigger a drop to $120.0-$118.0, a zone that previously attracted strong buying interest and is the last important defense before $117.0 becomes the next focus.
Technically, SOL is still trading below its exponential moving average (EMA) 100 and 200, keeping the market bias neutral to bearish. Narrowing Bollinger Bands signal a potential volatility expansion similar to the previous consolidation phase.
Meanwhile, the continued contraction of open interest andspot outflows suggests that while speculative excess has been erased, investor confidence remains limited.
That’s the latest information about crypto. Follow us on Google News to get the latest crypto news about crypto projects and blockchain technology. Also, learn crypto from scratch with complete discussion through Pintu Academy and stay up-to-date with the latest crypto market such as bitcoin price today, xrp coin price today, dogecoin and other crypto asset prices through Pintu Market.
Enjoy an easy and secure crypto trading experience by downloading Pintu crypto app via Google Play Store or App Store now. Also, get a web trading experience with various advanced trading tools such as pro charting, various types of order types, and portfolio tracker only at Pintu Pro.
*Disclaimer
This content aims to enrich readers’ information. Pintu collects this information from various relevant sources and is not influenced by outside parties. Note that an asset’s past performance does not determine its projected future performance. Crypto trading activities have high risk and volatility, always do your own research and use cold cash before investing. All activities of buying and selling bitcoin and other crypto asset investments are the responsibility of the reader.
Reference:
- CoinEdition. Solana Price Prediction: SOL Faces Neutral-Bearish Bias Across Key Metrics. Accessed on December 24, 2025
Latest News
© 2026 PT Pintu Kemana Saja. All Rights Reserved.
The trading of crypto assets is carried out by PT Pintu Kemana Saja, a licensed and regulated Digital Financial Asset Trader supervised by the Financial Services Authority (OJK), and a member of PT Central Finansial X (CFX) and PT Kliring Komoditi Indonesia (KKI). Crypto asset trading is a high-risk activity. PT Pintu Kemana Saja do not provide any investment and/or crypto asset product recommendations. Users are responsible for thoroughly understanding all aspects related to crypto asset trading (including associated risks) and the use of the application. All decisions related to crypto asset and/or crypto asset futures contract trading are made independently by the user.