5 Bitcoin (BTC) Scenarios to $100K: 15% Surge, Triangle, and Important Technicals!
Jakarta, Pintu News – Bitcoin (BTC), as the most dominant cryptocurrency with the largest capitalization, is now trading above $90,000 and is analyzed to have a technical opportunity to break the $100,000 level again. This projection is based on a symmetrical triangle chart pattern, which could indicate a potential breakout in the coming week according to crypto market analyst Ali Martinez through his post on social media X. The data in this article refers to NewsBTC reports and recent technical analysis.
1. Symmetrical Triangle Pattern Becomes a Leading Indicator
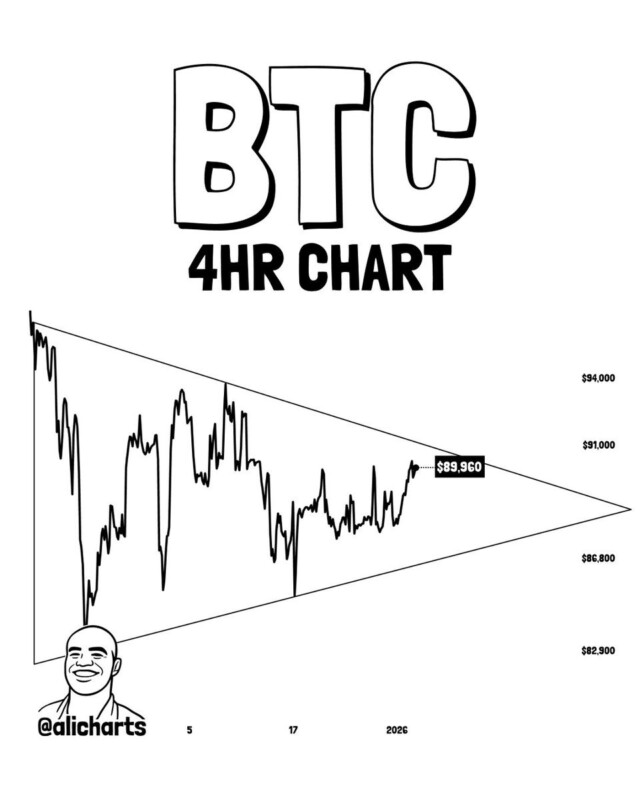
The symmetrical triangle pattern seen on the 4-hour time frame BTC chart, shows that the price is consolidating between two trend lines that are approaching each other. In this pattern, the price usually breaks in the direction of the initial trend before the consolidation takes place, so it can be a follow-up technical signal. Analyst Ali Martinez thinks that this pattern could point in a bullish direction if BTC manages to breakout above the pattern’s upper resistance.
The key resistance to watch is around the $91,000 level, where BTC needs at least two closing candlesticks above this level to confirm a bullish breakout. If the breakout occurs, continued momentum could result in higher price targets.
Similar patterns are often used by technical traders to assess the potential for continued trends, so an accurate reading of this pattern becomes important in determining the direction of BTC.
Also Read: 2026, a Hopeful Year for Solana: Predictions and Challenges
2. 15% Upside Target Toward $102,000
Based on the size of the symmetrical triangle pattern, technical projection calculations suggest that Bitcoin could increase by about 15 percent from the current price level and reach a target above $102,000. This target is ambiguous but still within the classical limits of technical chart projections.
The $102,000 target itself is an important psychological and technical level as it represents the point at which BTC manages to break back into the six-figure area after consolidation. However, this technical projection remains dependent on the confirmation of the breakout.
If BTC is able to reach this target, it would reflect a strong buyer push after the period of consolidation that occurred in early 2026. This upside target also offers context for the medium-term direction of the cryptocurrency market.
3. The Role of Volatility Levels and Price Consolidation
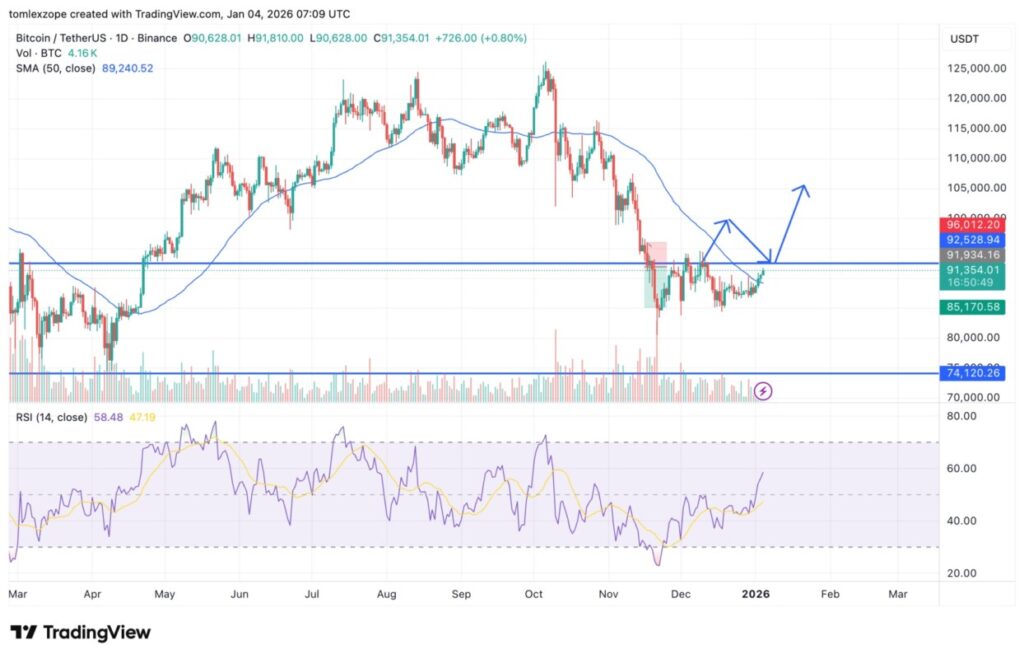
Bitcoin has shown relatively stable price dynamics at the beginning of the year after moving above the $90,000 level, although the overall market still expresses high uncertainty towards short-term price action. This uncertainty is reflected in the price consolidation that forms a symmetrical triangle pattern.
In this consolidation phase, volatility usually drops while buyers and sellers wait for clearer directional signals. A breakout signal from this consolidation can bring a significant change in trend direction.
Traders often wait for a daily or weekly close above a key breakout level to confirm a change in direction before making position adjustments. This is a common practice in technical analysis of assets like BTC.
4. Risk of Rejection and Breakdown
While the main focus of this report is the possibility of a bullish breakout, there is also a risk that the price could fail to break the resistance in the symmetrical triangle pattern. If BTC fails to close above that resistance consistently, the price could move down towards lower support areas.
This type of breakdown risk usually occurs when selling pressure increases or market sentiment changes abruptly due to negative macro market news or external events. This may force traders to take a safe position by selling early.
Short-term traders need to monitor early breakouts or breakdowns to avoid false breakouts that can lead to losses if technical signals are not confirmed.
5. Broader Context of Crypto Market 2026
Technical predictions like these do not stand alone; Bitcoin’s direction is also influenced by the broader dynamics of the cryptocurrency market, including global market liquidity, institutional adoption, and macroeconomic conditions that can affect risk sentiment.
For example, long periods of consolidation often reflect a market phase waiting for a strong catalyst before the next major trend takes shape. In this context, a breakout above $91,000 would be a signal that bullish momentum could return.
Monitoring global news, on-chain data, and technical indicators remains important to get a holistic view of the movement of BTC and the broader crypto market.
Also Read: Ripple’s (XRP) Big Breakthrough in 2026, Are You Ready?
Follow us on Google News to get the latest information about crypto and blockchain technology. Check Bitcoin price today, Solana price today, Pepe coin and other crypto asset prices through Pintu Market.
Enjoy an easy and secure crypto trading experience by downloading Pintu crypto app via Google Play Store or App Store now. Also, get a web trading experience with various advanced trading tools such as pro charting, various types of order types, and portfolio tracker only at Pintu Pro.
*Disclaimer
This content aims to enrich readers’ information. Pintu collects this information from various relevant sources and is not influenced by outside parties. Note that an asset’s past performance does not determine its projected future performance. Crypto trading activities are subject to high risk and volatility, always do your own research and use cold hard cash before investing. All activities of buying andselling Bitcoin and other crypto asset investments are the responsibility of the reader.
Reference
- NewsBTC. Bitcoin Price To Reclaim $100K In Imminent 15% Move. Accessed January 5, 2026.
Latest News
© 2026 PT Pintu Kemana Saja. All Rights Reserved.
The trading of crypto assets is carried out by PT Pintu Kemana Saja, a licensed and regulated Digital Financial Asset Trader supervised by the Financial Services Authority (OJK), and a member of PT Central Finansial X (CFX) and PT Kliring Komoditi Indonesia (KKI). Crypto asset trading is a high-risk activity. PT Pintu Kemana Saja do not provide any investment and/or crypto asset product recommendations. Users are responsible for thoroughly understanding all aspects related to crypto asset trading (including associated risks) and the use of the application. All decisions related to crypto asset and/or crypto asset futures contract trading are made independently by the user.