Ethereum Hits $3,250 Today — Is ETH Showing Signs of Strong Resilience?
Jakarta, Pintu News – Ethereum (ETH) has shown remarkable resilience since the correction phase that occurred in 2022-2023.
Based on the market observations shared by Yimin X, the current price structure of ETH resembles a leading diagonal pattern, which indicates the possible start of the 5th Wave according to the Elliott Wave theory.
Then, how will Ethereum price move today?
Ethereum Price Up 1.56% in 24 Hours
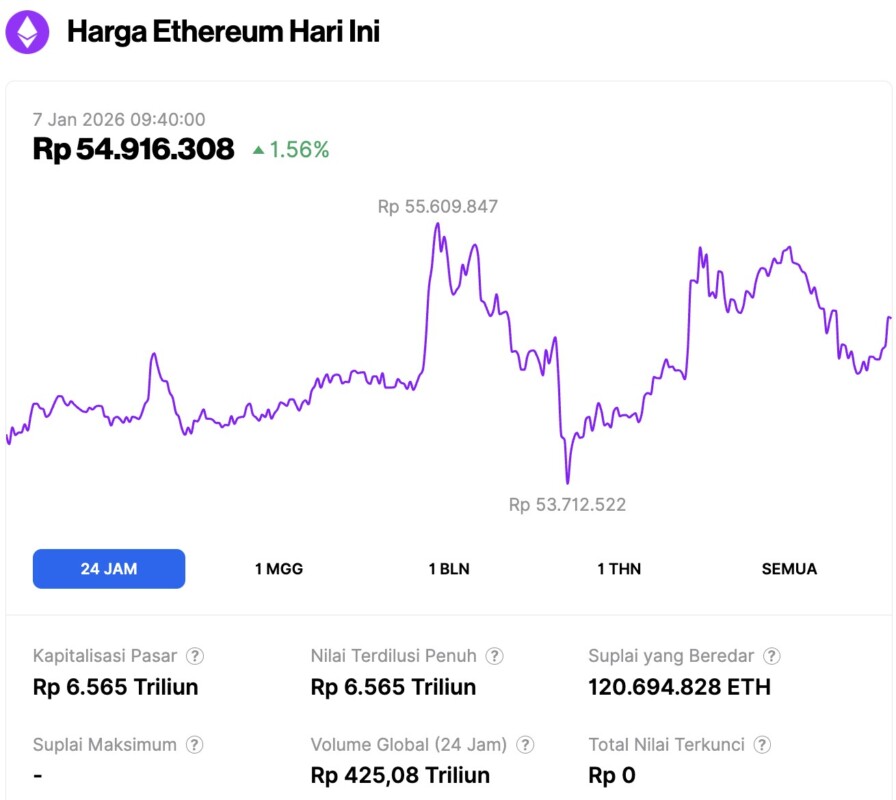
On January 7, 2026, Ethereum was trading at approximately $3,256, or around IDR 54,916,308 — marking a 1.56% increase over the past 24 hours. Within that time frame, ETH dipped to a low of IDR 53,712,522 and climbed to a high of IDR 55,609,847.
At the time of writing, Ethereum’s market capitalization is estimated at IDR 6.57 trillion, while its 24-hour trading volume has risen by 11% to reach IDR 425.08 trillion.
Read also: 3 Major Events This Week That Could Rock the Crypto Market, What Are They?
Ethereum shows strong resilience after 2022-2023 correction
Historically, the current ETH wave is usually the strongest in a cycle, with the potential for significant price increases. While a target in the $8,500-$11,000 range sounds ambitious, it’s important to note that Ethereum reached the $3,000 level five years ago-demonstrating real long-term growth potential.
The weekly chart of ETH/USD shows a rising broadening wedge pattern, characterized by two rising and widening trend lines, reflecting increasing volatility. The recent low around $3,000 is consistent with the corrective phase of Wave 4, which forms within the ABC complex pattern-common in long-term bull markets.
The volume profile shows a high concentration of liquidity in the $2,600-$3,600 range, signaling strong buying interest in this area. Keeping prices above this zone would strengthen the bullish outlook, while a drop below it could indicate the risk of a deeper correction.
Ethereum Momentum Signals Show Consolidation and Strengthening
Technical indicators suggest that Ethereum is heading for a strengthening phase after its previous decline.
The RSI (Relative Strength Index) is in a bullish neutral area, with a pattern of higher lows and no bearish divergence. This suggests that the selling pressure is starting to ease and Ether has the potential to continue rising. In addition, the histogram on the MACD indicator shows a downward narrowing, indicating weakening bearish momentum.
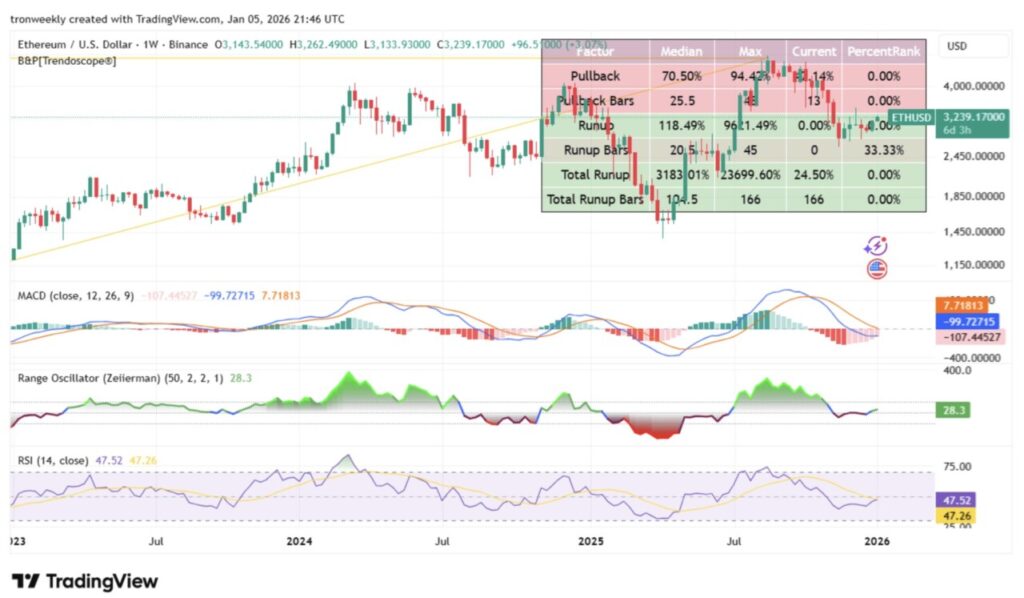
Although the range oscillator has retreated above the zero level – signaling that volatility on dips is starting to diminish – the price range indicator has started moving to the middle area. Historically, this pattern signals that prices are likely to stabilize or potentially resume an uptrend.
Read also: Altcoin Market Holds Key Support – Ready for the Next Big Rally?
Ethereum’s weekly RSI in the range of 45-50 also indicates a fairly strong uptrend.
Fibonacci Levels Define a Long-Term Roadmap
In terms of market structure, the potential for Ethereum to enter a long-term bullish phase is clear. Based on Fibonacci Extension calculations, the first major target is at the level of 1,236 to 1,382, which ranges from $11,000 to $13,500-aligned with previous structural estimates.
For higher extensions at the 1,618, 2.0, and 2,382 levels, the price targets are in the range of $17,000 to $43,000. Meanwhile, the most optimistic target is at the 2,618 level, which projects the price of Ethereum could reach around $57,000.
That’s the latest information about crypto. Follow us on Google News to get the latest crypto news about crypto projects and blockchain technology. Also, learn crypto from scratch with complete discussion through Pintu Academy and stay up-to-date with the latest crypto market such as bitcoin price today, xrp coin price today, dogecoin and other crypto asset prices through Pintu Market.
Enjoy an easy and secure crypto trading experience by downloading Pintu crypto app via Google Play Store or App Store now. Also, get a web trading experience with various advanced trading tools such as pro charting, various types of order types, and portfolio tracker only at Pintu Pro.
*Disclaimer
This content aims to enrich readers’ information. Pintu collects this information from various relevant sources and is not influenced by outside parties. Note that an asset’s past performance does not determine its projected future performance. Crypto trading activities have high risk and volatility, always do your own research and use cold cash before investing. All activities of buying and selling bitcoin and other crypto asset investments are the responsibility of the reader.
Reference:
- TronWeekly. Ethereum (ETH) Eyes $11K-$13K As Weekly Charts Show Bullish Structure. Accessed on January 7, 2026
Latest News
© 2026 PT Pintu Kemana Saja. All Rights Reserved.
The trading of crypto assets is carried out by PT Pintu Kemana Saja, a licensed and regulated Digital Financial Asset Trader supervised by the Financial Services Authority (OJK), and a member of PT Central Finansial X (CFX) and PT Kliring Komoditi Indonesia (KKI). Crypto asset trading is a high-risk activity. PT Pintu Kemana Saja do not provide any investment and/or crypto asset product recommendations. Users are responsible for thoroughly understanding all aspects related to crypto asset trading (including associated risks) and the use of the application. All decisions related to crypto asset and/or crypto asset futures contract trading are made independently by the user.