Dogecoin Weakens Today — Chart Patterns Suggest Accumulation Phase
Jakarta, Pintu News – Dogecoin (DOGE) is showing signs of a significant shift after several years in a predominantly bearish market structure.
Recent price movements on both short-term and long-term time frames indicate that the meme coin may be preparing for a larger directional move, while market participants are closely watching DOGE’s response around key technical levels.
So, how is the Dogecoin price moving today?
Dogecoin price drops 1.85% in 24 hours
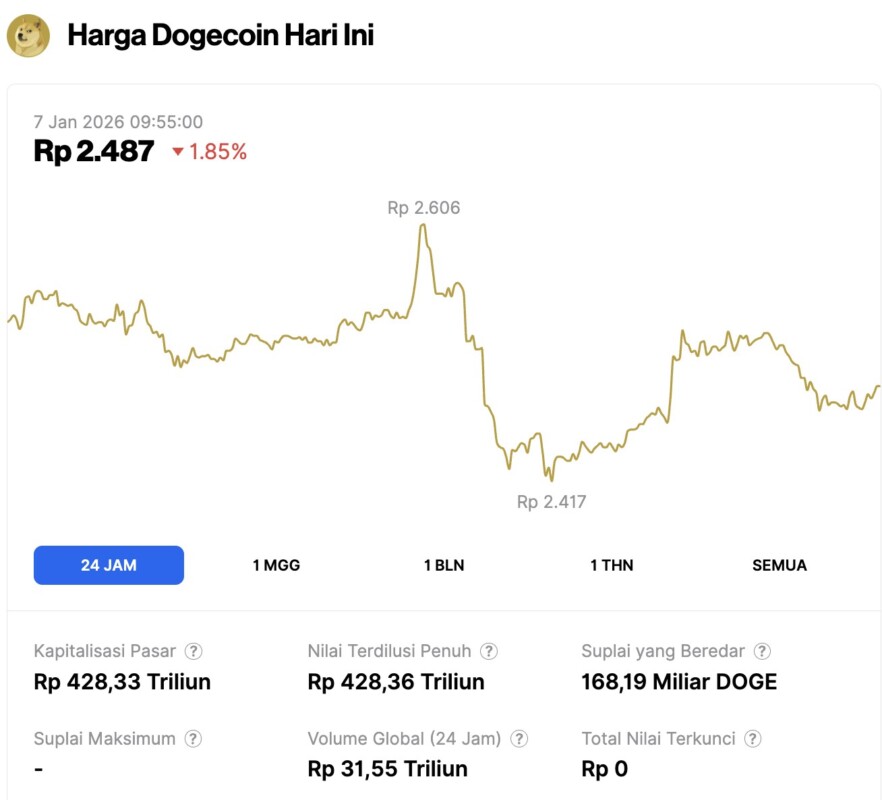
On January 7, 2026, Dogecoin saw a 1.85% dip over the past 24 hours, trading at $0.1478, which is approximately IDR 2,487. During the same 24-hour period, DOGE fluctuated between IDR 2,606 and IDR 2,417.
At the time of writing, Dogecoin holds a market capitalization of around IDR 428.33 trillion, with a 24-hour trading volume of roughly IDR 31.55 trillion.
Read also: Ethereum Price Reached $3,250 Today: ETH Shows Strong Resilience?
Weekly Structure Shows Potential Trend Shift
Analyst X by the name of Trader Tardigrade notes that Dogecoin is currently visible on the weekly chart, where the price continues to touch the descending trendline that has limited the upside since its peak in 2021. It is this trendline that has kept Dogecoin in a downward trend throughout most of the current cycle.
What makes this situation different is the price response after breaking the trendline in 2024. Instead of experiencing a sharp rejection, DOGE showed a retracement and retest in the same region.
This retest is important because it signals that an area of resistance may turn into an area of acceptance, especially if there is confidence from buyers to continue defending the region.
The current price structure also suggests compression around the trendline, with a series of higher lows compared to the bottoms formed in 2022 and 2023.
From a market cycle perspective, if DOGE is able to hold strong above this trend line, it could turn into a support level and potentially push the price back to test higher resistance levels as recorded in late 2021 to 2022.
Dogecoin Daily Chart Shows Accumulation After Liquidity Sweep
On the daily chart (6/1), BitGuru analysts pointed out some clear market phases to explain why the bearish bias still remains in the Dogecoin market.
Read also: Spectacular Surge of Meme Coin Market in Early 2026: What’s Happening?
In the early stages of the market movement, it was seen that DOGE formed arounded base pattern and then entered a strong expansion phase until it peaked slightly above the $0.25 level. However, in the first week of October, the price started to fall and swept away late long positions, resulting in the market sentiment turning negative.
The price declines that occurred in November and December were fairly controlled without any strong rallies or consistent patterns of lower highs. This suggests a distribution pattern, not a panic sell-off. When prices broke through equal lows, many stop losses were triggered, and liquidity on the sell side was absorbed.
After that liquidity sweep phase, Dogecoin entered a period of tight consolidation. Volatility began to diminish, and the downward pressure began to lose steam, although the price remained above the $0.12-$0.13 range.
The latest breakout in January 2026 shows that DOGE managed to return to the $0.14-$0.15 range with strong buying pressure, signaling a potential further upside movement after this accumulation phase.
That’s the latest information about crypto. Follow us on Google News to get the latest crypto news about crypto projects and blockchain technology. Also, learn crypto from scratch with complete discussion through Pintu Academy and stay up-to-date with the latest crypto market such as bitcoin price today, xrp coin price today, dogecoin and other crypto asset prices through Pintu Market.
Enjoy an easy and secure crypto trading experience by downloading Pintu crypto app via Google Play Store or App Store now. Also, get a web trading experience with various advanced trading tools such as pro charting, various types of order types, and portfolio tracker only at Pintu Pro.
*Disclaimer
This content aims to enrich readers’ information. Pintu collects this information from various relevant sources and is not influenced by outside parties. Note that an asset’s past performance does not determine its projected future performance. Crypto trading activities have high risk and volatility, always do your own research and use cold cash before investing. All activities of buying and selling bitcoin and other crypto asset investments are the responsibility of the reader.
Reference:
- TronWeekly. Dogecoin (DOGE) Eyes $0.21 Breakout As Trendline Tests Signal Bullish Reversal. Accessed on January 7, 2026
Latest News
© 2026 PT Pintu Kemana Saja. All Rights Reserved.
The trading of crypto assets is carried out by PT Pintu Kemana Saja, a licensed and regulated Digital Financial Asset Trader supervised by the Financial Services Authority (OJK), and a member of PT Central Finansial X (CFX) and PT Kliring Komoditi Indonesia (KKI). Crypto asset trading is a high-risk activity. PT Pintu Kemana Saja do not provide any investment and/or crypto asset product recommendations. Users are responsible for thoroughly understanding all aspects related to crypto asset trading (including associated risks) and the use of the application. All decisions related to crypto asset and/or crypto asset futures contract trading are made independently by the user.