Ethereum Price Hovers at $3,100 Today: ETH Weekly Market Structure Shows Compression
Jakarta, Pintu News – Ethereum (ETH) price is approaching a defining moment on the weekly time frame, where long-term structure is more important than short-term volatility.
After years of forming progressively higher lows in an ascending channel, ETH recently tried to break through a resistance level – but failed and was rejected. The rejection hasn’t broken the existing structure, but it has increased market tension.
Currently, the market is consolidating again, and traders prefer to wait for confirmation rather than speculate early. Then, how will Ethereum price move today?
Ethereum Price Drops 0.85% in 24 Hours
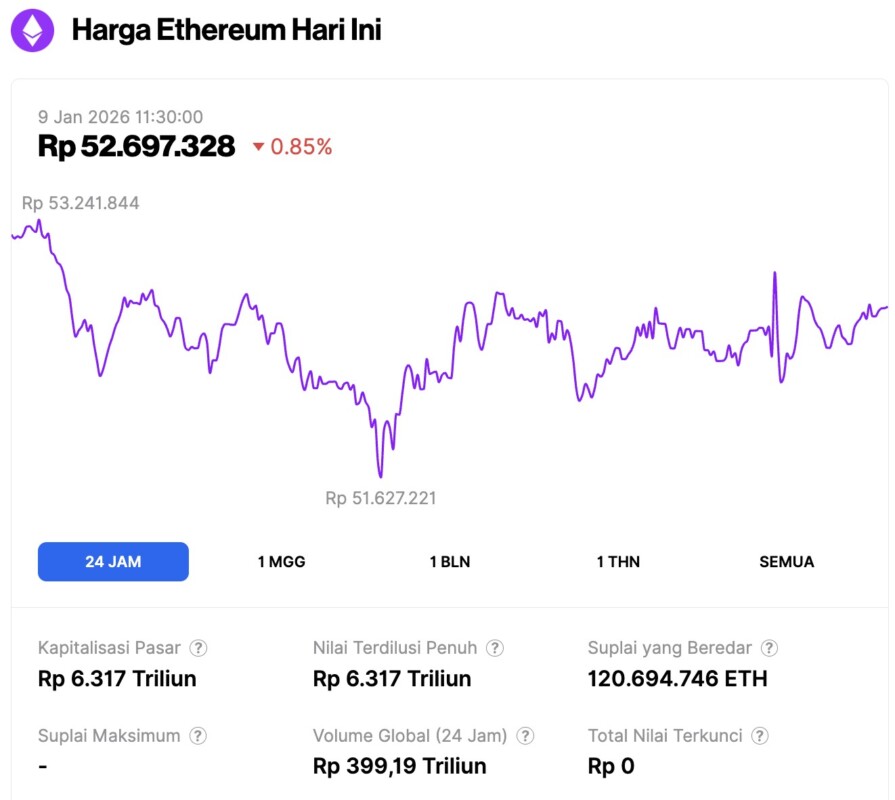
On January 9, 2026, Ethereum was trading at approximately $3,116, or around IDR 52,697,328 — marking a 0.85% decline over the past 24 hours. During this time, ETH had dipped to a low of IDR 51,627,221 and reached a high of IDR 53,241,844.
At the time of writing, Ethereum’s market capitalization is roughly IDR 6,317 trillion, while its daily trading volume has increased by 5% in the last 24 hours to IDR 399.19 trillion.
Read also: Bitcoin Hits $91,000 — Is This Reversal a Sign of Further Decline Ahead?
Ethereum’s Weekly Market Structure Shows Compression, Not Weakness
On the weekly chart, Ethereum is still maintaining the long-term upward channel that has been forming since the 2022 cycle low. Every major correction has resulted in a higher low, indicating that demand remains strong at higher prices.
But on the other hand, ETH is still struggling to break through the long-term resistance trend line, forming a narrowing range of movement.
This combination of steadily rising support and restrained price increases is a classic pattern of the volatility compression structure. The market won’t stay compressed – there will eventually be a sharp move when one side gives up. Crucially, ETH has not yet broken out of that rising support boundary.
As long as the higher-low structure is maintained, the overall bullish bias on the weekly time frame still prevails.
False Breakout Above Resistance: Why It’s More Important than Harmful
Ethereum’s recent move through resistance only to be rejected may seem bearish at first glance. But actually, false breakouts like this are common near significant market turning points.
Movements like this are typical:
- Getting rid of late-entering long positions
- Reset funding and leverage levels
- Changing sentiment from confident to cautious
These conditions are often the basis for actual big moves, rather than canceling out potential market direction. What’s more important is not the failed breakout itself, but rather how the price reacted afterward. To date, Ethereum has been able to absorb the rejection without breaking key support – showing resilience, not weakness.
Read also: ZEC price plummets after Zcash development team resigns, what happened?
Weekly Key Levels and Potential Scenarios
Ethereum is currently stuck between upside support and long-term resistance. The most important signal traders are waiting for is a clean weekly candle close above the upper trendline, not just a temporary wick.
Such a close would confirm a structural breakout and potentially pave the way towards an upside target to the $6,500-$7,000 region, in line with the long-term projections on the chart.
Conversely, if rejection continues to occur near resistance or Ethereum loses the support of the ascending channel decisively, then the bullish structure will weaken. This scenario will likely lead to a longer consolidation or a deeper correction phase, thus delaying any further upside potential.
Until one of these two scenarios is confirmed, traders should anticipate volatility with no clear direction. Weekly closes will mean much more than intraday moves, and patience is key in this phase of the market structure.
Conclusion
Ethereum’s weekly chart is now approaching a completion point after years of being in a compression phase. The recent false breakout has not invalidated the long-term structure, but it emphasizes the importance of confirmation going forward.
In the event of a decisive weekly breakout, it will mark a major change in the market structure. Conversely, failure to break through resistance will keep ETH prices moving within a limited range.
Until there is clear confirmation, volatility is likely to continue – and under these conditions, discipline is far more important than predictability.
That’s the latest information about crypto. Follow us on Google News to get the latest crypto news about crypto projects and blockchain technology. Also, learn crypto from scratch with complete discussion through Pintu Academy and stay up-to-date with the latest crypto market such as bitcoin price today, xrp coin price today, dogecoin and other crypto asset prices through Pintu Market.
Enjoy an easy and secure crypto trading experience by downloading Pintu crypto app via Google Play Store or App Store now. Also, get a web trading experience with various advanced trading tools such as pro charting, various types of order types, and portfolio tracker only at Pintu Pro.
*Disclaimer
This content aims to enrich readers’ information. Pintu collects this information from various relevant sources and is not influenced by outside parties. Note that an asset’s past performance does not determine its projected future performance. Crypto trading activities have high risk and volatility, always do your own research and use cold cash before investing. All activities of buying and selling bitcoin and other crypto asset investments are the responsibility of the reader.
Reference:
- Coinpedia. Ethereum Weekly Chart Tightens Near Resistance, Is a Major Move Coming for ETH Price? Accessed on January 9, 2026
Latest News
© 2026 PT Pintu Kemana Saja. All Rights Reserved.
The trading of crypto assets is carried out by PT Pintu Kemana Saja, a licensed and regulated Digital Financial Asset Trader supervised by the Financial Services Authority (OJK), and a member of PT Central Finansial X (CFX) and PT Kliring Komoditi Indonesia (KKI). Crypto asset trading is a high-risk activity. PT Pintu Kemana Saja do not provide any investment and/or crypto asset product recommendations. Users are responsible for thoroughly understanding all aspects related to crypto asset trading (including associated risks) and the use of the application. All decisions related to crypto asset and/or crypto asset futures contract trading are made independently by the user.