Ethereum (ETH) Struggles to Reach $3,000, Is it Bullish or Bearish?
Jakarta, Pintu News -Ethereum(ETH) has recently declined from the $3,000 resistance and is currently trying to recover. If it manages to break $3,120, a potential price recovery could occur.
Ethereum (ETH) Market Conditions
Ethereum (ETH) failed to maintain its position above $3,050 and experienced a sharp decline, similar to Bitcoin (BTC). Ethereum (ETH) price dropped below $3,020 and $3,000, entering the bearish zone. This decline continued until the price bottomed out at $2,865, before finally consolidating the losses. There was a slight rise above the 23.6% Fibonacci retracement level of the last downward move from $3,366 to $2,865.
Also Read: Is Gen Z Investing Only in Crypto a Smart Decision or Not? Here’s What Analysts Say!
Ethereum (ETH) Price Recovery Efforts
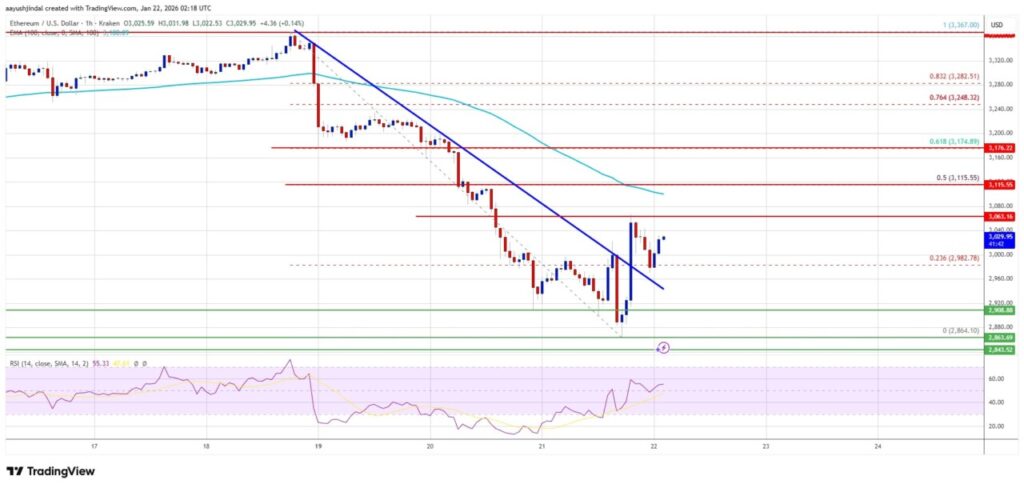
After the decline, Ethereum (ETH) tried to recover by breaking a major bearish trend line with resistance at $3,000 on the ETH/USD hourly chart. Despite this, Ethereum (ETH) is still trading below $3,050 and the 100-hour simple moving average. If the bulls can prevent a further drop below $2,900, there is a chance that the price will try to rise again.
Immediate resistance is near the $3,065 level. The first key resistance is near $3,100, with the next major resistance near $3,120, which is also the 50% Fibonacci retracement level of the last drop. If Ethereum (ETH) manages to break the $3,120 resistance, the price could move towards $3,175.
Potential for Continued Decline
If Ethereum (ETH) is unable to break the $3,065 resistance, the price may experience a fresh decline. Initial support is near the $2,980 level, with the next major support in the $2,900 zone. If the price moves below the $2,900 support, this could push Ethereum (ETH) towards support at $2,840. A further drop could direct the price towards $2,780, with the next major support at $2,720.
Technical Indicators
The hourly Moving Average Convergence Divergence (MACD) indicator for Ethereum (ETH) is showing a loss of momentum in the bearish zone. Meanwhile, the hourly Relative Strength Index (RSI) for Ethereum (ETH) is now above the 50 zone. This suggests that there could be more buying pressure emerging if Ethereum (ETH) can maintain this momentum.
Conclusion
The current price dynamics of Ethereum (ETH) indicates a fight between bulls and bears in the market. The key to price recovery is Ethereum’s (ETH) ability to break and hold above critical resistance levels. Investors and traders should keep an eye on technical indicators and key support levels in anticipation of the next price move.
Also Read: XRP price slumps, will it surge at the end of January 2026?
Follow us on Google News to stay up to date with the latest crypto and blockchain technology. Check Bitcoin price, USDT to IDR and Nvidia stock price tokenized via Pintu Market.
Enjoy an easy and secure crypto trading experience by downloading the Pintu crypto app via Play Store or App Store now. Also, experience web trading with advanced trading tools such as pro charting, various order types, and portfolio tracker only at Pintu Pro.
*Disclaimer
This content aims to enrich readers’ information. Pintu collects this information from various relevant sources and is not influenced by outside parties. Note that an asset’s past performance does not determine its projected future performance. Crypto trading activities are subject to high risk and volatility, always do your own research and use cold hard cash before investing. All activities of buying and selling Bitcoin and other crypto asset investments are the responsibility of the reader.
Reference
- NewsBTC. Ethereum Price Attempts to Bounce at $3K. Accessed on January 23, 2026
Latest News
© 2026 PT Pintu Kemana Saja. All Rights Reserved.
The trading of crypto assets is carried out by PT Pintu Kemana Saja, a licensed and regulated Digital Financial Asset Trader supervised by the Financial Services Authority (OJK), and a member of PT Central Finansial X (CFX) and PT Kliring Komoditi Indonesia (KKI). Crypto asset trading is a high-risk activity. PT Pintu Kemana Saja do not provide any investment and/or crypto asset product recommendations. Users are responsible for thoroughly understanding all aspects related to crypto asset trading (including associated risks) and the use of the application. All decisions related to crypto asset and/or crypto asset futures contract trading are made independently by the user.