February 2026 Solana Price Prediction: Test Resistance Area at $147, Potential Return to $200?
Jakarta, Pintu News – Solana (SOL) price movements in recent months have been under pressure as global crypto market sentiment weakens. Since early September 2025, the altcoin has been moving in a medium-term downtrend due to declining interest in risky assets.
However, recent data suggests a potential change in direction ahead of February 2026. A combination of institutional support, medium-term holder behavior, and technical indicators are starting to shape the recovery narrative for this cryptocurrency.
Institutional Interest Supports Solana
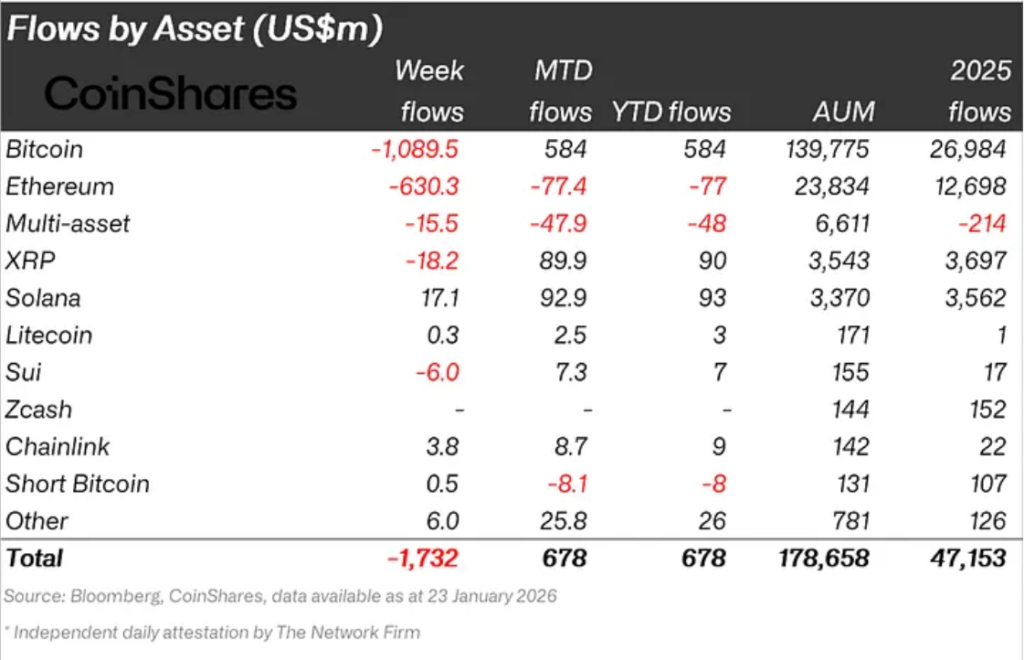
Amidst the price pressure, institutional investors’ interest in Solana was maintained. Fund flow data shows that from January to January 23, Solana recorded an inflow of USD 92.9 million or around Rp1.55 trillion. This figure makes Solana the crypto asset with the second largest institutional fund flow after Bitcoin (BTC). This position indicates great investor confidence in Solana’s medium-term prospects.
The trend is even more prominent on a weekly basis. In the week ending January 23, Solana was the only major altcoin to record positive net fund flows, while other assets experienced outflows. This data reinforces the narrative that Solana has its own appeal in the eyes of institutions. This kind of support is often the initial foundation for price recovery.
Read also: Crypto Payments Hit Critical Point: 39% of Merchants Accept Crypto, Big Banks Jump In
SOL Holder shows recovery confidence
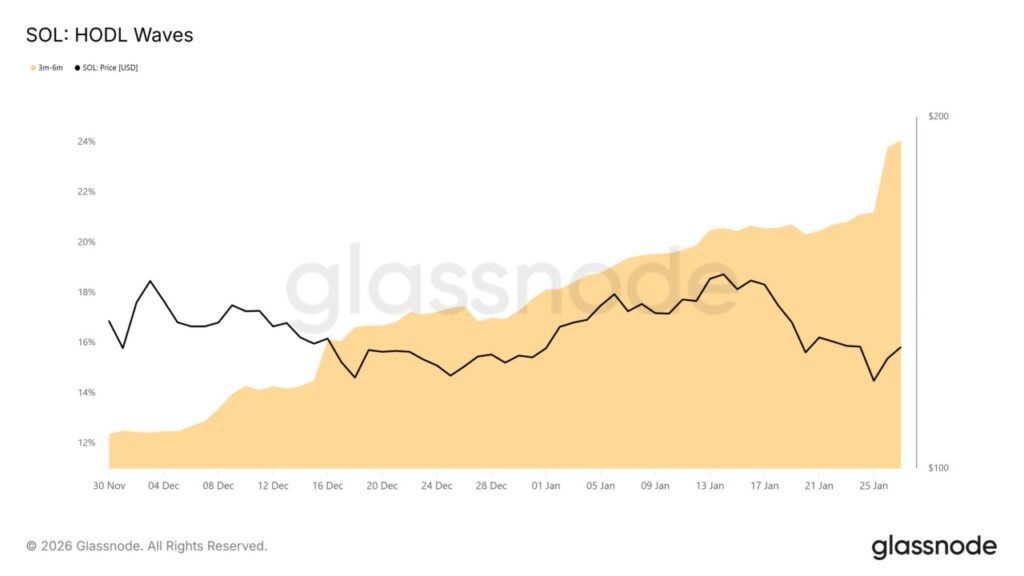
Apart from institutions, the behavior of retail investors and medium-term holders also showed positive signals. HODL Waves data shows a significant increase in the group of Solana holders with a holding duration of 3 to 6 months. In a short period of time, the share of this group increased from 21 percent to 24 percent of the total SOL supply. The majority of them entered the market around October 2025.
Interestingly, many of these holders are currently in a loss position. However, instead of selling, they choose to hold on. This attitude reflects expectations of future price recovery. When selling pressure is reduced, prices tend to stabilize and make room for further accumulation.
Technical Indicators Start Favoring
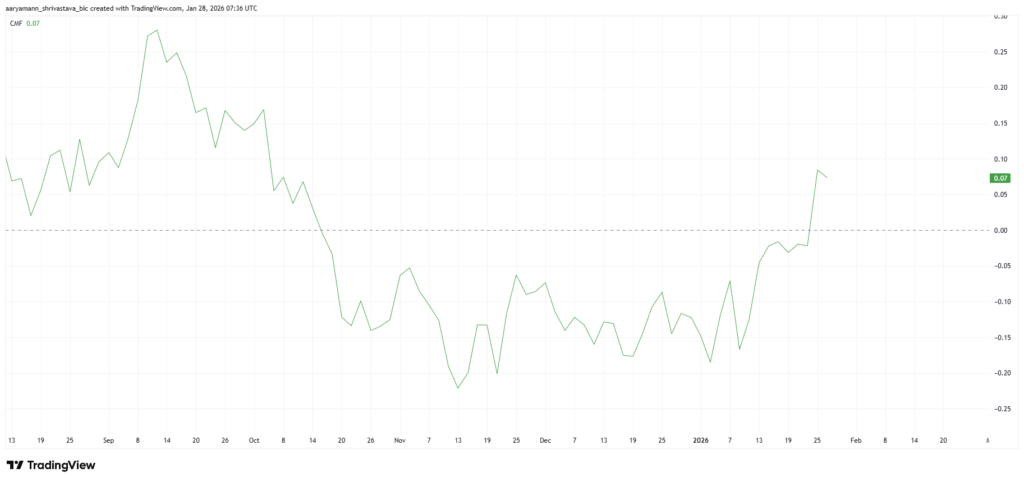
On the technical front, some momentum indicators are starting to support the recovery narrative. The Chaikin Money Flow (CMF), which measures capital inflows and outflows based on price as well as volume, recently moved into positive territory. This is the first time the CMF has been above the zero line since early October. This change signals the return of fund flows to Solana.
The combination of institutional inflows, holder confidence, and technical indicators creates a healthier market structure. Although the long-term downtrend has not been fully broken, the downward pressure appears to be easing. This increases the chances of a gradual reversal. For the cryptocurrency market, signals like this are often the start of a consolidation phase leading to a rally.
Also read: XRP Depressed in Early 2026, Q1 Was Tough but Q2 Could Be a Turning Point?
Solana Price Projections in February 2026
Currently, Solana is trading at around USD 127 or around Rp2.12 million. This level is still holding above the key support zone of USD 116, which acted as a price floor during the last period of volatility. The stability of this area reduces the risk of a sharp decline in the short term. Although still below the long-term downtrend line, the price structure is starting to improve.
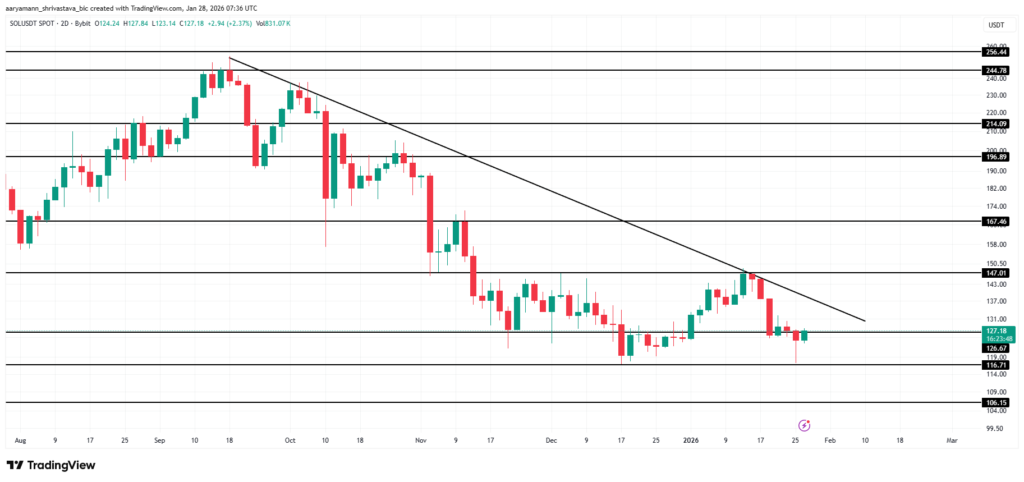
Historically, February is known to be a fairly strong month for Solana. The average SOL price performance in February recorded an increase of around 38 percent. If this seasonal pattern is repeated, Solana prices have the potential to test the resistance area at USD 147 or around IDR 2.46 million. A break of this level could pave the way to a further target of USD 167, even opening up opportunities to return above USD 200 in the next cycle.
However, a negative scenario remains worth noting. If global macro pressures increase again or buying interest weakens, Solana prices risk breaking the USD 116 support. Under these conditions, a drop towards USD 106 or even below USD 100 is a possibility. This scenario would invalidate the short-term bullish thesis.
Follow us on Google News to stay up to date with the latest in crypto and blockchain technology. Check Bitcoin price, usdt to idr and tokenized nvidia stock price via Pintu Market.
Enjoy an easy and secure crypto trading experience by downloading the Pintu crypto app via Play Store or App Store now. Also, experience web trading with advanced trading tools such as pro charting, various types of order types, and portfolio tracker only at Pintu Pro.
*Disclaimer
This content aims to enrich readers’ information. Pintu collects this information from various relevant sources and is not influenced by outside parties. Note that an asset’s past performance does not determine its projected future performance. Crypto trading activities are subject to high risk and volatility, always do your own research and use cold hard cash before investing. All activities of buying and selling Bitcoin and other crypto asset investments are the responsibility of the reader.
Reference:
- BeInCrypto. What To Expect From Solana Price In February 2026? Accessed January 29, 2026
- Featured Image: Crypto Rank
Latest News
© 2026 PT Pintu Kemana Saja. All Rights Reserved.
The trading of crypto assets is carried out by PT Pintu Kemana Saja, a licensed and regulated Digital Financial Asset Trader supervised by the Financial Services Authority (OJK), and a member of PT Central Finansial X (CFX) and PT Kliring Komoditi Indonesia (KKI). Crypto asset trading is a high-risk activity. PT Pintu Kemana Saja do not provide any investment and/or crypto asset product recommendations. Users are responsible for thoroughly understanding all aspects related to crypto asset trading (including associated risks) and the use of the application. All decisions related to crypto asset and/or crypto asset futures contract trading are made independently by the user.