Is XRP at Risk of a February 2026 Collapse? Seasonal Trends, Whale Activity, & Key Price Levels Hold the Answers
Jakarta, Pintu News – XRP (XRP) has started February under pressure. In the last 24 hours, the token’s price has fallen nearly 7%, and about 5% in the last month – reflecting the weak overall market conditions.
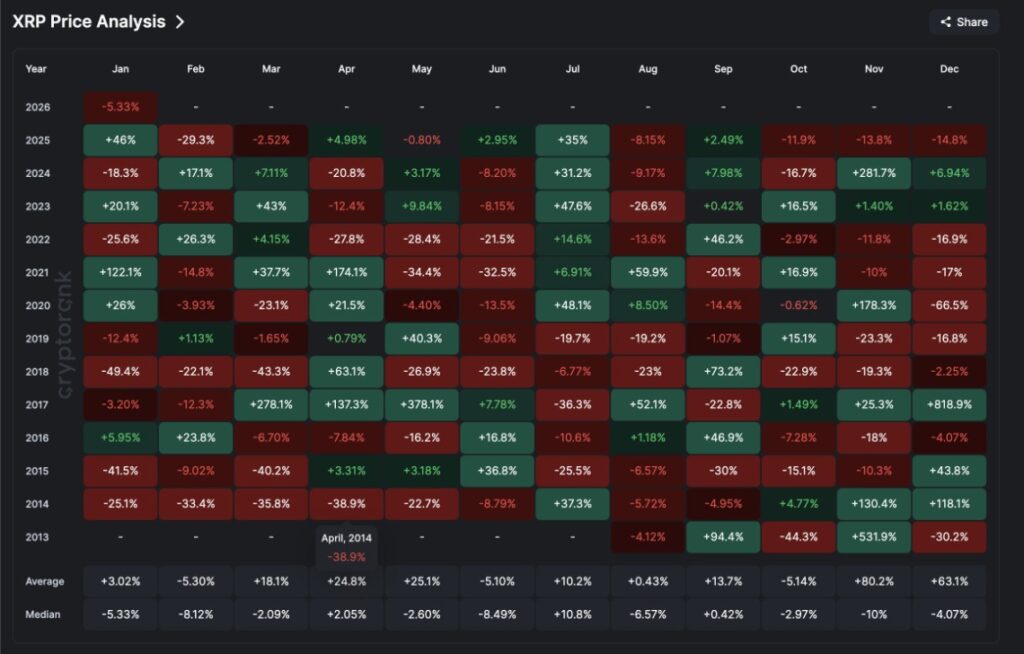
Historically, February has not been a favorable month for XRP price. Data shows that the median XRP yield in February was -8.12%, with an average decline of -5%. In 2025, the token even dropped nearly 29% during the same period.
For this year, technical signals and on-chain data suggest similar risks are taking shape. However, the presence of selective accumulation as well as early momentum indicators give hope that a recovery is still possible. Here is a summary of the available data.
Why the Price Drop Was Expected
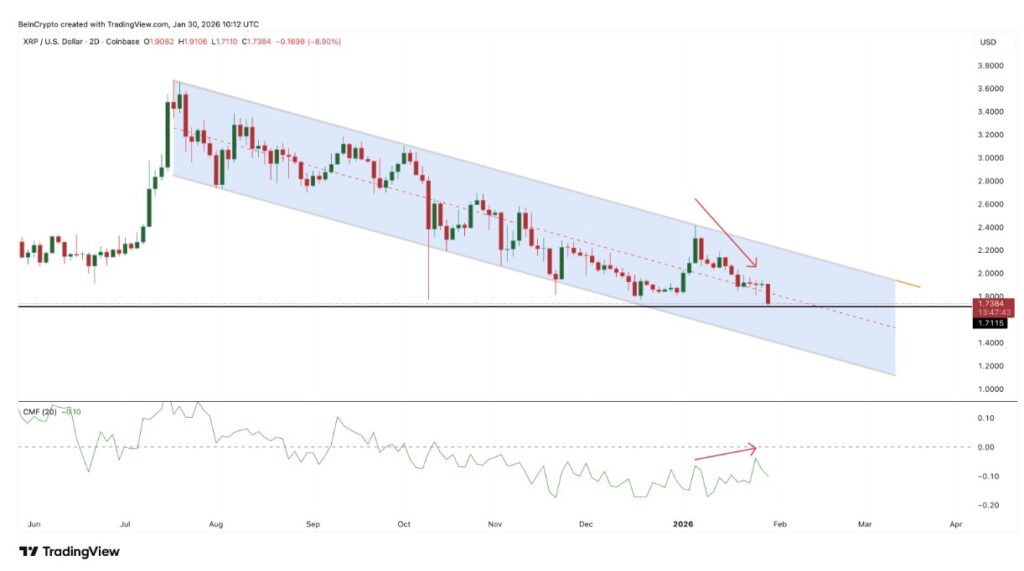
XRP is still moving within a long-term descending channel pattern on the two-day chart. This pattern indicates a bearish trend, where the price keeps printing lower tops and lower bottoms between two parallel trend lines.
Read also: Ethereum Price Outlook for February 2026: Will ETH Soar or Plunge?
Since mid-2025, this pattern has limited price increases and driven consistent downward movement. As February approaches-which is historically a weak month for XRP-the price is getting closer to the lower boundary of the channel, increasing the risk of further declines.
Vasily Shilov, Chief Business Development Officer at SwapSpace, says that seasonal patterns are still relevant, but no longer the main determining factor.
“Fund flows from ETFs are currently a more reliable driver of market direction,” he explained. “As long as there is no clarity on the macroeconomic front, price movements will most likely remain within a limited range,” he added.
However, this technical weakness did not happen suddenly.
Between October 2 and January 5, XRP printed lower peak prices, while the Relative Strength Index (RSI) formed higher peaks. RSI is a momentum indicator that measures the strength of buying or selling pressure.
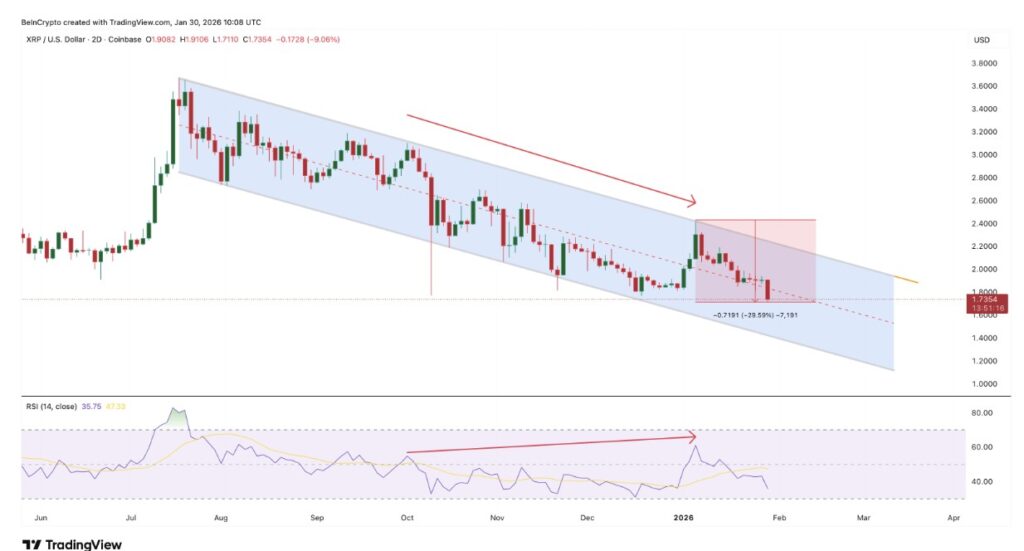
This mismatch is called a hidden bearish divergence, which is usually a signal that the upside strength is starting to weaken before a correction. This signal appeared in early January, and was followed by a price drop of almost 30%.
Now, a new pattern is taking shape.
Between October 10 and January 29, the XRP price printed a lower base, while the RSI attempted to form a higher base. This formed the basis for a bullish divergence, which could signal the downtrend was starting to lose steam.
For this signal to be confirmed, the following two conditions must be met:
- The next 2-day XRP price candle needs to close above $1.71, to confirm the lower price base pattern.
- The RSI should remain above the 32.83 level.
If these two conditions are achieved, selling pressure weakens and chances of recovery increase. Otherwise, the bearish pattern within the descending channel remains dominant.
Fund Flow and Whale Activity Show Mixed Signals
While the price of XRP continues to come under pressure, capital flow data paints a more complicated picture.
Chaikin Money Flow (CMF)-an indicator that monitors buying pressure from institutions and large wallet holders-actually increased between January 5 and January 25, despite the price drop. This created a bullish divergence, indicating that large players, likely institutional investors, were quietly accumulating XRP during the price drop.
Fund flow data from ETFs reinforced this trend. Although overall ETF flows in January were still negative due to the large outflow on January 21, the net inflow improved gradually towards the end of the month. The appearance of green bars on the chart indicates renewed interest from the institutional channel.
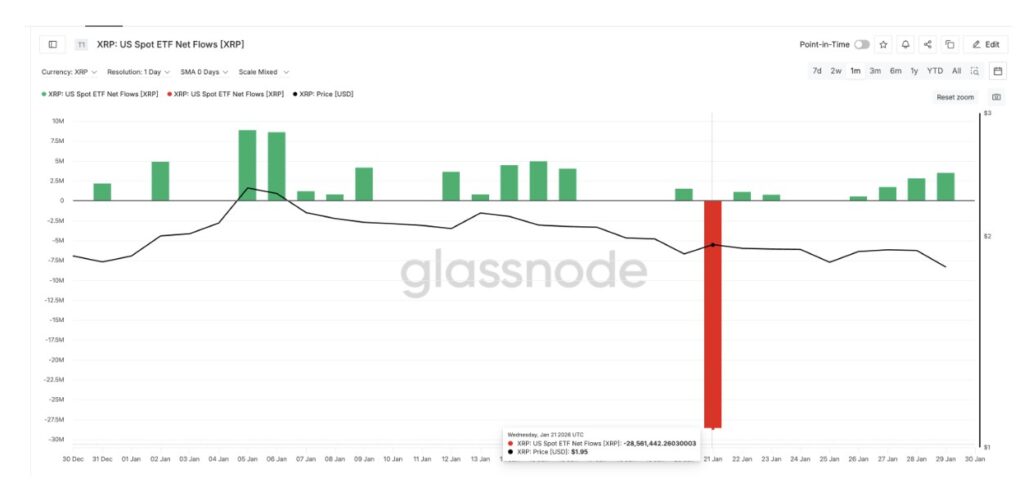
Shilov explained that the ETF’s volatility during January reflected macroeconomic caution more than structural weakness in XRP demand.
“While macro pressures have led investors to prefer safe assets like gold and silver, the XRP spot ETF has still managed to attract more than $1.3 billion since launch, and has yet to record a month with net redemptions,” he explained.
“The scale and consistency of these inflows suggest that a trend reversal is not likely in the near future,” he added.
However, this optimism is starting to be tested by data from crypto exchanges. Since January 17, the balance of XRP flowing into exchanges increased sharply-flipping from -7.64 million to +3.78 million. More worrying is the pattern of movement.
Read also: Jupiter Global Develops Stablecoins for QR Payments, Fiat Transfers, and Card Transactions
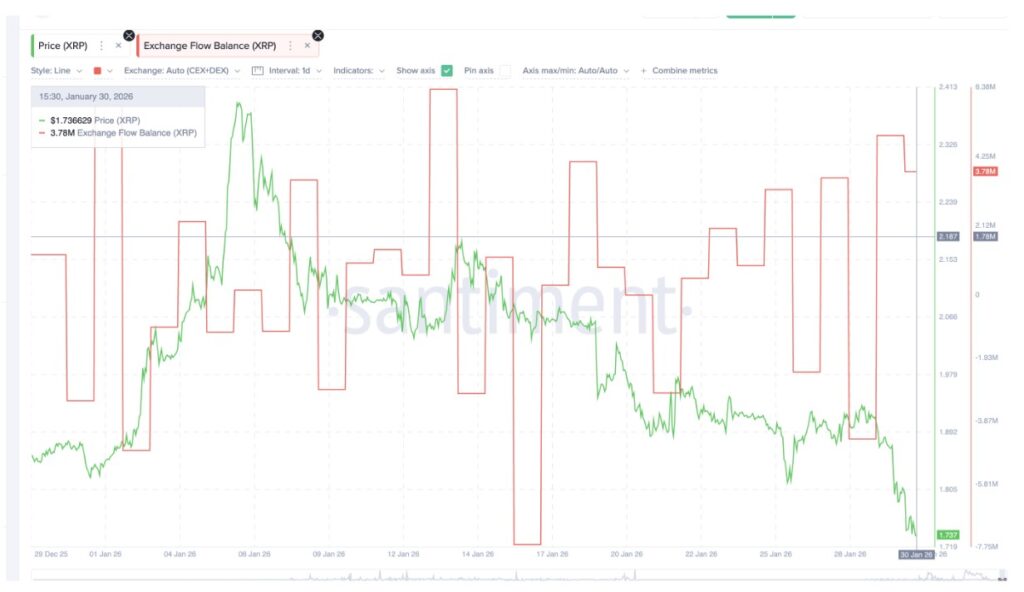
There were three consecutive inflow peaks on January 25, 27, and 29. A similar pattern also occurred earlier on January 4, 8, and 13, after which the price of XRP dropped from $2.10 to $1.73-a drop of about 18%. Such an inflow pattern signals the risk of further downside, despite the positive sentiment from the ETF.
Shilov also emphasized that demand from ETFs alone has not been strong enough to fully protect XRP from broader market pressures. Based on trading data from SwapSpace, he mentioned that XRP’s short-term movements are still heavily influenced by Bitcoin trends and macro risk sentiment, especially when ETF flows become volatile.
“BTC direction, macro pressures, and positioning in the derivatives market are likely to be the main determinants of risk appetite in the near term,” he said.
XRP Whale Behavior Provides Interesting Perspective
Whale behavior (large asset holders) provides an additional layer of analysis. Wallets holding more than 1 billion XRP have been recorded as continuing to accumulate since early January, when the price correction began. Their holdings increased from 23.35 billion to 23.49 billion XRP, indicating a large capital outflow during the market downturn.
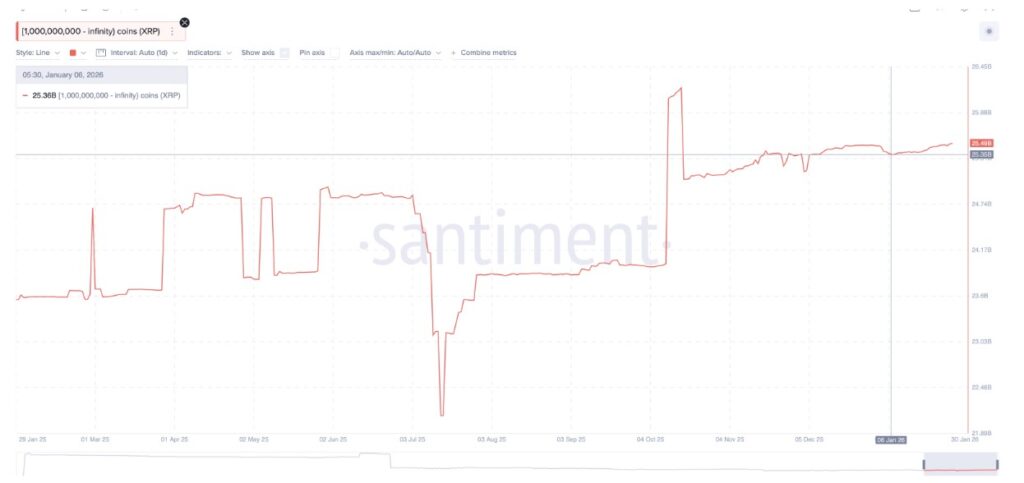
Unlike last year, where the big whales waited until late February to buy, this time they started building positions earlier in the cycle. This may reduce the likelihood of a sharp decline, although it still does not eliminate the risk of a short-term decline.
Shilov cautions that accumulation by large holders should be seen in a broader context. In his opinion, the current pattern resembles a tactical maneuver rather than a form of long-term conviction.
“Consistent accumulation will only be effective if it is accompanied by a steady flow of ETF funds,” he said. “Otherwise, buying interest can dissipate quickly when macroeconomic pressures increase.”
These conflicting signals also explain the 5% price drop in January, which was less severe than the roughly 15% drop in December 2025.
Key Support Levels, Downside Risks, and XRP Price Recovery Scenarios
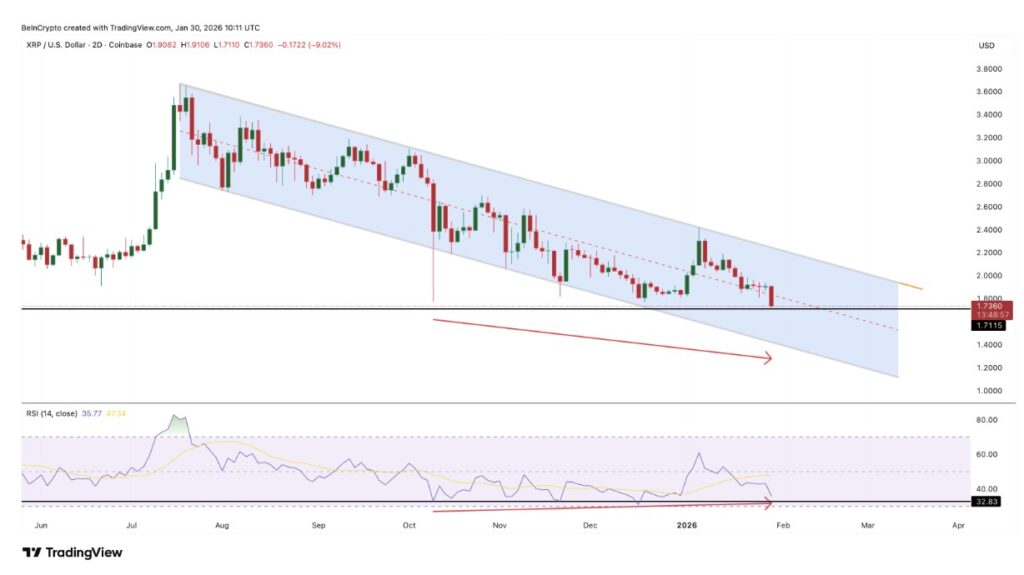
XRP’s current price structure makes clear the important levels to watch. The first zone that XRP must defend is in the range of $1.71-$1.69. If the price closes for two consecutive days below this area, then the support of the trend channel could weaken and open up the potential for a deeper decline.
If this scenario plays out, the next major support level is around $1.46. A sustained drop below this point could trigger a faster sell-off, and push the price down further towards $1.24.
This possibility will increase if inflows to exchanges continue to grow and demand for ETFs does not strengthen.
On the upside, the recovery hinges on one important level: XRP must be able to break $1.97 again with a valid two-day close. This would be a signal that short-term resistance has been broken, and buyers are starting to control the market again. This level was also previously highlighted by BeInCrypto analysts.
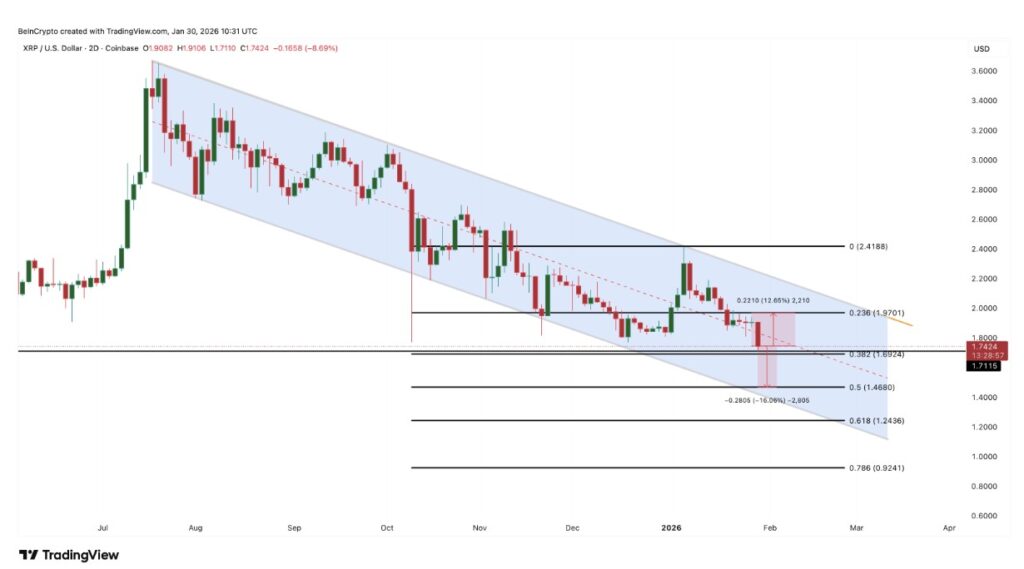
If XRP manages to move steadily above $1.97, then the upside potential could open up towards $2.41, which is in line with the Fibonacci resistance level and the upper boundary of the price channel.
Looking ahead, Shilov mentioned that the strongest confirmation for a bullish breakout would be the return of steady ETF inflows like during the launch in November.
“Weekly fund flows of between $80 million to $200 million will build strong momentum above $2.10,” he said.
He also mentioned the possibility of a downturn, which is in line with technical analysis:
“If global geopolitical conditions or macro pressures worsen further, XRP’s decline could deepen and push the price down below $1.70,” he added.
Currently, XRP’s price battle centers on two major levels: support at $1.69 and resistance at $1.97. Which level is broken first will most likely determine the direction of XRP’s price movement throughout the rest of February.
Follow us on Google News to stay up to date with the latest in crypto and blockchain technology. Check Bitcoin price, usdt to idr and tokenized nvidia stock price via Pintu Market.
Enjoy an easy and secure crypto trading experience by downloading the Pintu crypto app via Play Store or App Store now. Also, experience web trading with advanced trading tools such as pro charting, various order types, and portfolio tracker only at Pintu Pro.
*Disclaimer
This content aims to enrich readers’ information. Pintu collects this information from various relevant sources and is not influenced by outside parties. Note that an asset’s past performance does not determine its projected future performance. Crypto trading activities are subject to high risk and volatility, always do your own research and use cold hard cash before investing. All activities of buying and selling Bitcoin and other crypto asset investments are the responsibility of the reader.
Reference:
- BeInCrypto. XRP Price Prediction February 2026. Accessed on February 2, 2026
Latest News
© 2026 PT Pintu Kemana Saja. All Rights Reserved.
The trading of crypto assets is carried out by PT Pintu Kemana Saja, a licensed and regulated Digital Financial Asset Trader supervised by the Financial Services Authority (OJK), and a member of PT Central Finansial X (CFX) and PT Kliring Komoditi Indonesia (KKI). Crypto asset trading is a high-risk activity. PT Pintu Kemana Saja do not provide any investment and/or crypto asset product recommendations. Users are responsible for thoroughly understanding all aspects related to crypto asset trading (including associated risks) and the use of the application. All decisions related to crypto asset and/or crypto asset futures contract trading are made independently by the user.