6 Ethereum Signals Drop 20%: IDR 36 Million Price is ETH’s Critical Point

The price movement of Ethereum is back in the spotlight after experiencing a sharp correction and missing the psychological level of USD 2,200. This sparked the attention of crypto market participants as it indicates a short-term change in momentum that is important to understand, especially by novice investors who are starting to take the dynamics of cryptocurrencies more seriously.
1. Ethereum Fails to Stay Above USD 2,500
Ethereum (ETH) had previously moved above USD 2,500 or around IDR 41,970,000 assuming an exchange rate of 1 USD = IDR 16,788. However, selling pressure increased when the price failed to maintain that level and began to form a gradual downtrend.
This failure signals that the USD 2,500 area is now serving as a strong resistance. As long as the price is below this level, ETH’s movement is likely to be limited and prone to further pressure in the crypto market.
Also Read: 5 BTC History Facts February often bounces back after January slump!
2. 20% Drop Changes Short-Term Price Structure
After the rejection from the upper area, the price of Ethereum (ETH) recorded a drop of about 20 percent from its local peak. This correction changed the short-term price structure from neutral to bearish.
In the context of cryptocurrencies, double-digit corrections are often an adjustment phase after high volatility. Technically, however, this is still worth keeping an eye on as it suggests diminishing buying interest in the short term.
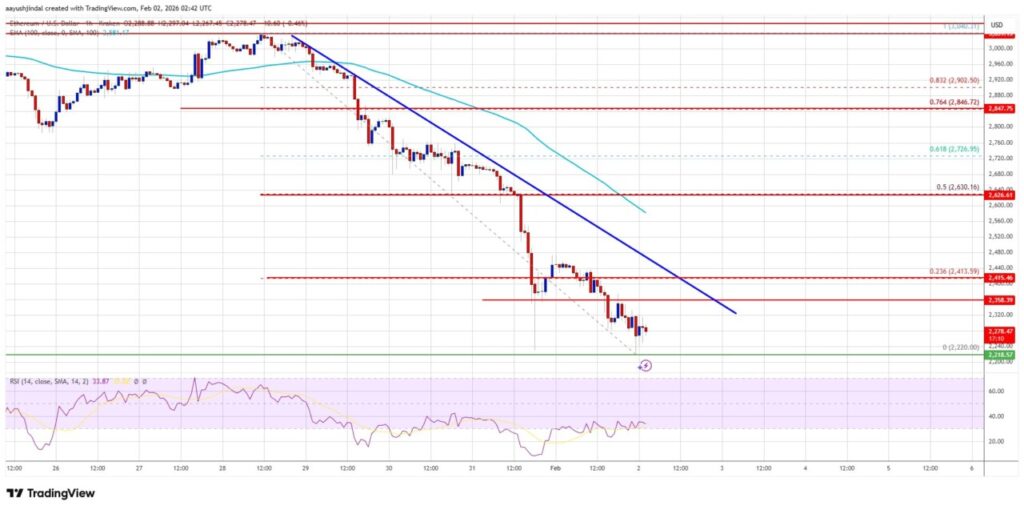
3. USD 2,200 Level is the Main Support
Currently, ETH is trading at around USD 2,200 or equivalent to IDR 36,934,000. This level is considered crucial support because it is a psychological and technical limit that determines the next direction.
If this support fails to hold, the risk of a decline towards the area below USD 2,000 or around IDR 33,576,000 begins to open up. Conversely, a hold above this level could trigger a consolidation phase before a new direction is formed.
4. Technical Indicators Still Showing Pressure
Technically, Ethereum (ETH) price is below the 100-hour Simple Moving Average. This position usually indicates that the short-term momentum is still on the sellers’ side.
Moreover, the chart structure suggests that recovery attempts are still limited as long as ETH has not been able to return above the immediate resistance area. This reflects a crypto market that is still cautiously waiting for confirmation of direction.
5. Resistance Zone Above Current Price
Ethereum’s (ETH) closest resistance is in the range of USD 2,350 to USD 2,420. In rupiah terms, this range is equivalent to around IDR 39,421,800 to IDR 40,635,000.
A break above this zone could open up short-term recovery opportunities. However, as long as the price remains below this area, downward pressure remains the dominant scenario in the technical analysis of the cryptocurrency.
6. Implications for Beginner Crypto Investors
For novice investors, this ETH movement confirms that volatility is the main character of the crypto market. Sharp drops do not necessarily mean a change in the long-term trend, but reflect the dynamics of demand and supply.
A neutral, data-driven approach helps investors understand risk without getting carried away by excessive sentiment. By understanding support and resistance levels, cryptocurrency investors can read price movements in a more rational and measured manner.
Also Read: Michael Saylor aims to buy Bitcoin when BTC drops to USD 78,000!
Follow us on Google News to stay up to date with the latest crypto and blockchain technology. Check Bitcoin price, USDT to IDR and Nvidia stock price tokenized via Pintu Market.
Enjoy an easy and secure crypto trading experience by downloading the Pintu crypto app via Play Store or App Store now. Also, experience web trading with advanced trading tools such as pro charting, various order types, and portfolio tracker only at Pintu Pro.
*Disclaimer
This content aims to enrich readers’ information. Pintu collects this information from various relevant sources and is not influenced by outside parties. Note that an asset’s past performance does not determine its projected future performance. Crypto trading activities are subject to high risk and volatility, always do your own research and use cold hard cash before investing. All activities of buying and selling Bitcoin and other crypto asset investments are the responsibility of the reader.
Reference
- Aayush Jindal/NewsBTC. Ethereum Price $2,200 Collapse Raises Risk Of A Sub-$2K Spike. Accessed February 3, 2026.


