Solana Slides 35% as Selling Pressure Fades and Buyers Seize the Dip
Jakarta, Pintu News – If you’ve been monitoring the price of Solana (SOL) for some time, it’s worth noting that SOL has corrected more than 35% since mid-January. Currently, the price is below $100 – a level SOL hasn’t touched in quite some time.
It will be interesting to see if prices continue to fall, or if there are signs of a potential recovery that could be an opportunity for optimistic traders.
Solana price drops more than 35% since January
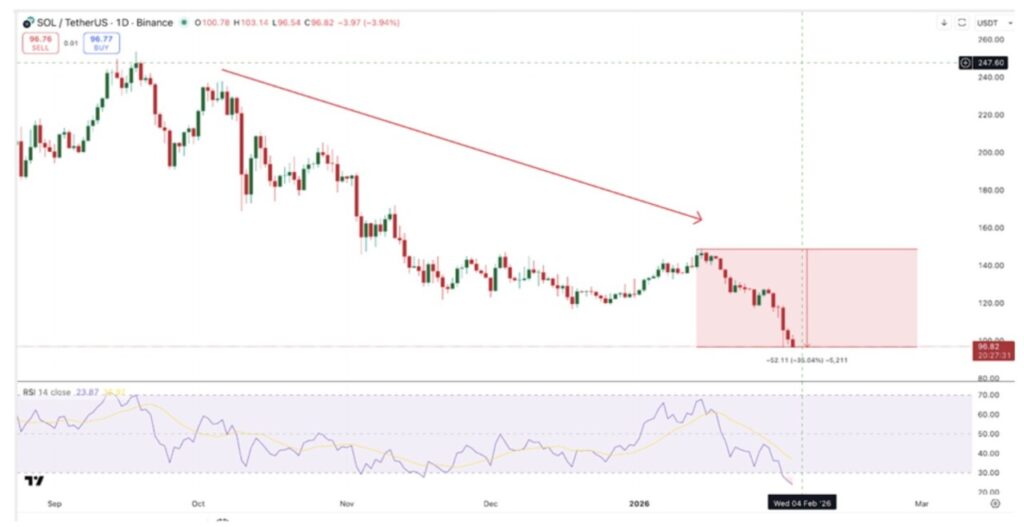
Solana’s price weakness did not just start in February. The downward trend has been visible since around January 13, when the price was still around $148. Since then, selling pressure has slowly increased, even though the crypto market in general looks quite stable.
Read also: Pi Network Price Up 3% Today: Will Pi Coin Hold Above $0.1500?
If you look at the chart, there were already warning signs. Between October and mid-January, the price recorded higher highs, but the RSI indicator rose faster. This created a hidden bearish divergence, which simply means the momentum was unhealthily strong – it looked strong on the surface, but started to weaken inside.
Then, the crypto market as a whole started to show instability. Massive liquidations, negative sentiment, and reduced risk appetite made matters worse. Solana’s price dropped faster than many other large tokens.
In early February, Solana prices fell below $100 and briefly touched $96. This marked a correction of almost 35% from its January peak. In the last seven days, Solana’s losses amounted to more than 17%, making it one of the worst performing large-cap assets during this period.
This long decline shows that the price fall did not happen suddenly, but was a gradual accumulation of pressure – the market slowly adjusted its expectations to lower levels.
Buying Pressure Increases Despite Weak Prices
Although Solana’s price continues to decline, not all signals are negative. Some on-chain data suggests that buyers are quietly moving in.
One important indicator is theexchange net position change. On January 15, there was a net outflow of about 535,000 SOL from the exchange. This indicates accumulation. As the price approached $100 on February 1, the outflow jumped to more than 2.25 million SOL.
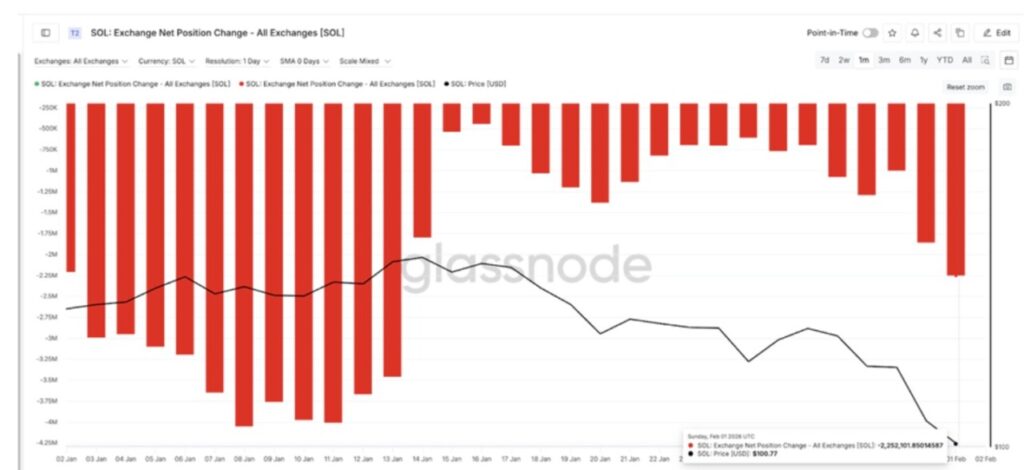
Outflows from exchanges usually signal that coins are being moved to private wallets for long-term storage – meaning some investors are taking advantage of the price drop to buy and hold.
Another important signal comes from the NUPL (Net Unrealized Profit/Loss) metric for short-term holders. This figure is currently at its lowest level since April last year, at around -0.54.
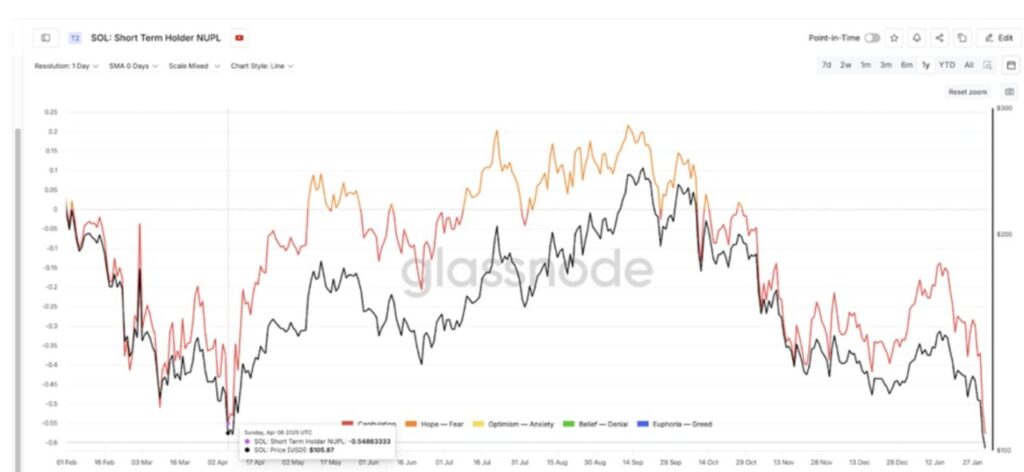
Interestingly, back in April when the NUPL was at this level, Solana’s price was around $105 and has since started to recover. The return to this zone suggests that many short-term holders are in a losing position, which often characterizes alocal bottom.
Read also: Dogecoin Price Jumps 4% Today: Can DOGE Reach $1.40 Target?
The RSI indicator is also approaching oversold territory. While this does not guarantee a price bounce, it does indicate that the selling pressure has been quite extreme and may start to weaken.
Overall, although prices appear weak, various indicators suggest that some investors are preparing for a possiblerebound.
Key Solana Price Levels to Watch
The direction in which the Solana price moves from this point will largely depend on a few important price levels. The most crucial is the support area around $94 – this level should hold. If the price closes the day below this point, the next possible zone is around $79, which means an additional potential drop of around 18% from current levels.
A drop to this level could happen quickly if market sentiment deteriorates again. Weak liquidity and fear in the market could accelerate the price drop in this area.
On theupside, the first level to watch is $104. If the daily price manages to close above this level, it could be a signal that buyers are starting to take control.
Furthermore, the $120 zone will be the next test point. This area previously served as support and could now turn into resistance. If the price is able to cross this point, short-term confidence in the market could increase.
However, to really change the overall trend, Solana needs to return above the $148 level, which was the price peak in January that started the long decline. Without passing this level, the general market structure is still considered weak.
Right now, Solana is in a difficult position. The price has corrected quite deeply; there are signs that buyers are starting to come back in, but the trend direction is still leaning down.
Follow us on Google News to stay up to date with the latest in crypto and blockchain technology. Check Bitcoin price, usdt to idr and tokenized nvidia stock price through Pintu Market.
Enjoy an easy and secure crypto trading experience by downloading the Pintu crypto app via Play Store or App Store now. Also, experience web trading with advanced trading tools such as pro charting, various order types, and portfolio tracker only at Pintu Pro.
*Disclaimer
This content aims to enrich readers’ information. Pintu collects this information from various relevant sources and is not influenced by outside parties. Note that an asset’s past performance does not determine its projected future performance. Crypto trading activities are subject to high risk and volatility, always do your own research and use cold hard cash before investing. All activities of buying and selling Bitcoin and other crypto asset investments are the responsibility of the reader.
Reference:
- CoinRepublic. Solana Price Down 35% As Selling Pressure Fades and Dip Buyers Step In. Accessed on February 3, 2026
Latest News
© 2026 PT Pintu Kemana Saja. All Rights Reserved.
The trading of crypto assets is carried out by PT Pintu Kemana Saja, a licensed and regulated Digital Financial Asset Trader supervised by the Financial Services Authority (OJK), and a member of PT Central Finansial X (CFX) and PT Kliring Komoditi Indonesia (KKI). Crypto asset trading is a high-risk activity. PT Pintu Kemana Saja do not provide any investment and/or crypto asset product recommendations. Users are responsible for thoroughly understanding all aspects related to crypto asset trading (including associated risks) and the use of the application. All decisions related to crypto asset and/or crypto asset futures contract trading are made independently by the user.