5 Facts of Bitcoin (BTC) LTH Profit-Taking Collapses and its Impact on Crypto Market
Jakarta, Pintu News – Bitcoin (BTC) in recent weeks has shown weak price movements below the level of around US$ 80,000, reflecting the strong selling pressure in the crypto market. In addition, profitability indicators from long-term holders (LTH) show significant behavioral changes that are important for investors and beginners to understand in assessing market conditions. Here are five key points from the latest report.
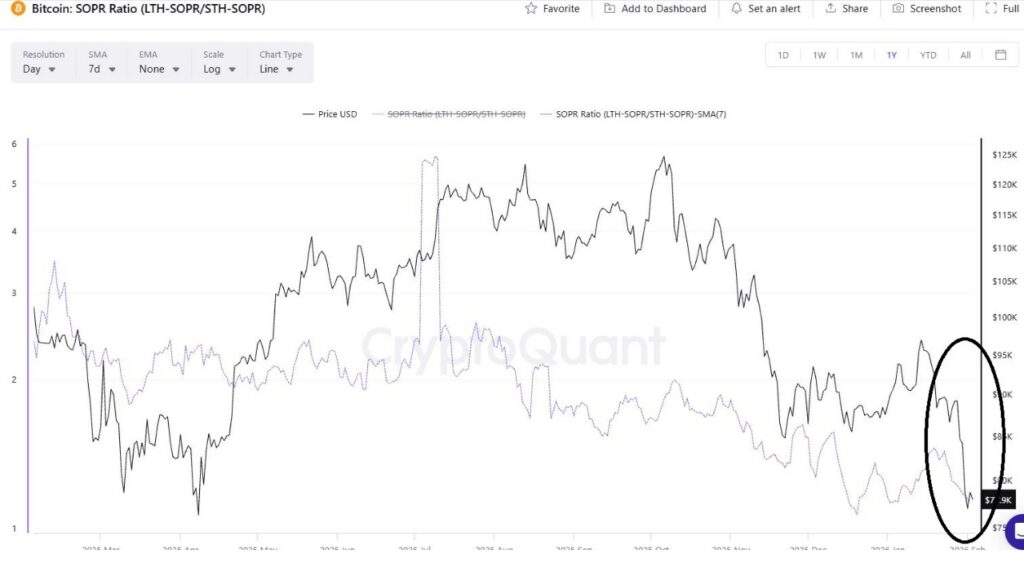
1. SOPR Reaches Lowest Level in a Year
One indicator that many are watching right now is the Spent Output Profit Ratio (SOPR), which shows whether the coins spent are making a profit or a loss for the holder. Recent reports reveal that Bitcoin’s SOPR has fallen to its lowest level in the past year, signaling a decline in profitability for most Bitcoin holders.
This drop in SOPR illustrates that many long-term holders are now choosing not to sell, as the profit potential is less than in the past. Historically, periods of low SOPR are sometimes a turning point when selling pressure begins to ease.
The interpretation of this indicator is important because changes in the behavior of long-term holders can affect broader market momentum. If the SOPR stabilizes near a critical number, the likelihood of a consolidation phase or price reversal increases.
Also Read: 7 Shocking Bitcoin & Crypto Facts in Epstein Files: Crypto’s Early Traces Revealed!
2. LTH Holds Sales, Signaling Distribution Reluctance
Recent on-chain data shows a convergence of behavior between long-term holders and short-term holders, but with a different emphasis on profitability. Many LTHs are reportedly delaying sales due to lower profits at the moment.
This change reflects a market structure where selling pressure from long-term players has decreased relatively, although short-term holders still face losses. Such conditions are often monitored to see if the market begins to stabilize after major selling pressure subsides.
This may not necessarily signal an instant price reversal, but it could be an early signal that the dominance of heavy selling is starting to soften.
3. BTC Price Still Below Key Psychological Levels
While the change in LTH behavior suggests that selling pressure is starting to ease, Bitcoin price is still trading below a psychologically important level for many market participants: around US$80,000. This situation suggests that the overall market is still in a volatile environment.
This price decline is related not only to investor behavior, but also to technical conditions, including the still-declining trend of moving averages. The selling pressure that has not fully subsided is reflected in the structure of the price chart, which has not shown any significant signs of reversal.
Until the major resistance that was previously turned into support is not broken again, downside risks remain according to the available technical data.
4. Limited Rebound Volume Signals No Strong Accumulation Action Yet
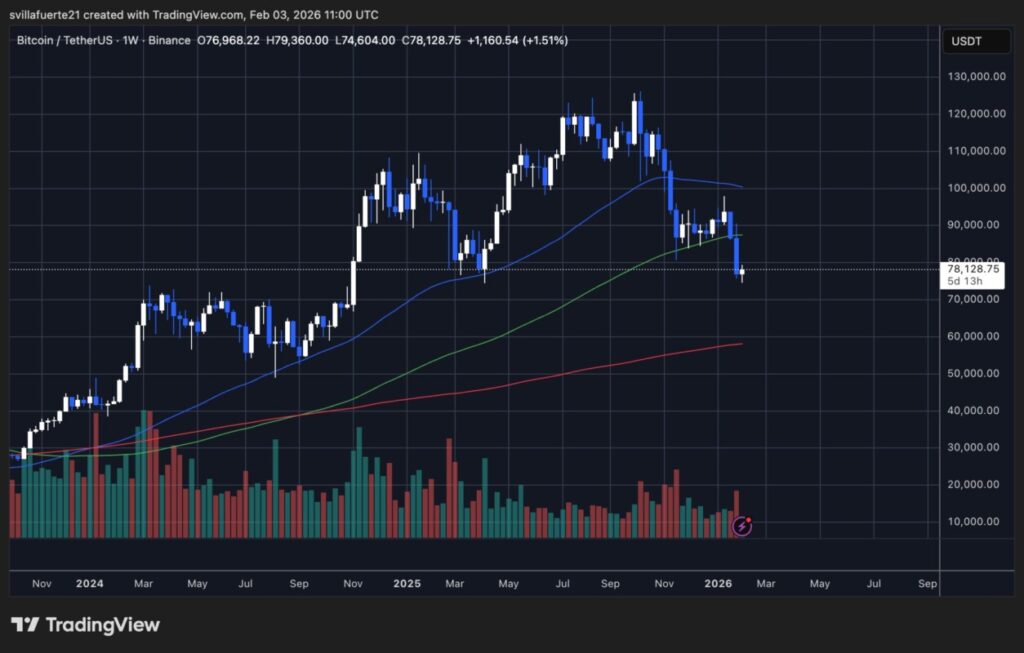
Despite a price rebound from a low of around US$74,000-US$76,000, volume data suggests that this rebound was driven by tactical buying or short covering rather than strong accumulation from large investors. Low volume in a rebound often indicates limited broad buying conviction.
This means that the market is still in a consolidation or corrective phase, rather than a strong bullish phase. Stronger buying action is usually characterized by much higher and consistent volume participation from different classes of investors.
Starting from this situation, investors need to pay attention to additional technical signals in order to evaluate when more obvious accumulation momentum occurs.
5. Long-term Implications for the Crypto Market
The change in LTH behavior as well as the low SOPR indicator could have broader implications on the cryptocurrency market. When long-term holders hold sales despite low profits, the market is sometimes in a phase of late selling pressure before stabilizing.
However, this does not necessarily mean that the selling pressure or volatility will disappear immediately. There is still a possibility that the market will consolidate for a period of time before a new trend is established.
Investors need to combine on-chain signals with other price data and market sentiment to see a clearer direction in the coming weeks or months. Continuous evaluation of indicators such as SOPR, support/resistance levels, and transaction volume will help in decision-making.
Also Read: 4 Shocking Facts about Bitcoin Breaking Rp1.42 Billion: Similar to BTC April 2025 Technical Signal!
Follow us on Google News to stay up to date with the latest crypto and blockchain technology. Check Bitcoin price, USDT to IDR and Nvidia stock price tokenized via Pintu Market.
Enjoy an easy and secure crypto trading experience by downloading the Pintu crypto app via Play Store or App Store now. Also, experience web trading with advanced trading tools such as pro charting, various order types, and portfolio tracker only at Pintu Pro.
*Disclaimer
This content aims to enrich readers’ information. Pintu collects this information from various relevant sources and is not influenced by outside parties. Note that an asset’s past performance does not determine its projected future performance. Crypto trading activities are subject to high risk and volatility, always do your own research and use cold hard cash before investing. All activities of buying and selling Bitcoin and other crypto asset investments are the responsibility of the reader.
Reference:
- NewsBTC. Bitcoin LTH Profit-Taking Collapses: Is Smart Money Done Selling? Accessed February 4, 2026.
Latest News
© 2026 PT Pintu Kemana Saja. All Rights Reserved.
The trading of crypto assets is carried out by PT Pintu Kemana Saja, a licensed and regulated Digital Financial Asset Trader supervised by the Financial Services Authority (OJK), and a member of PT Central Finansial X (CFX) and PT Kliring Komoditi Indonesia (KKI). Crypto asset trading is a high-risk activity. PT Pintu Kemana Saja do not provide any investment and/or crypto asset product recommendations. Users are responsible for thoroughly understanding all aspects related to crypto asset trading (including associated risks) and the use of the application. All decisions related to crypto asset and/or crypto asset futures contract trading are made independently by the user.