Dogecoin Poised for a Surge? Cycle Signals Emerge Amid Weekly PMO Decline
Jakarta, Pintu News – Dogecoin’s (DOGE) monthly chart shows a familiar pattern of a long consolidation phase followed by a sharp price spike, according to a cycle map shared by Tardigrade Traders.
Meanwhile, Bitcoinsensus highlighted a drop in the weekly PMO indicator that fell below the macro-threshold that previously appeared near a major low point in the market cycle.
Dogecoin Monthly Chart Shows Correction Pattern followed by a Spike
Dogecoin’s monthly chart shared by trader Tardigrade shows repeated cycles that combine long consolidation phases with sharp upward movements. In the chart, several cycles since 2014 are characterized by a price pattern that first declines and forms a curved bottom, then surges vertically in a phase referred to as a “pump”.
Read also: Dogecoin, Shiba Inu, and Pepe Coin Meme Predictions as Bitcoin Plummets Below $70,000!
This structure appears in various durations, which the trader classifies as standard, short, and long consolidations. As such, the chart depicts the history of Dogecoin’s price movements as a series of compression periods followed by rapid expansion.
This visual record shows that the duration of consolidation varies with each cycle, but all end with a significant price increase. In the early phases, the price spends longer forming a bottom before finally rising. In the later phases, the bottom forms faster and is immediately followed by a vertical spike.
This pattern emphasizes that although the timing of each cycle is different, the sequence remains consistent: price drop, range formation, then expansion-all within a monthly time frame.
The latest part of the chart shows Dogecoin is in a curved bottom formation phase after a long decline from the previous cycle peak. The price action is narrowing, with higher lows forming along the rising curve.
On the right side of the chart, there is a projection of a possible price spike like the one that occurred in the previous pump phases. Therefore, the current structure is considered to be the final stage of consolidation, not yet entering the expansion phase.
In previous cycles, the expansion phase started after the price managed to return above the major monthly support zone and break the upper limit of the curved bottom. Whenever this happens, the price immediately forms a sharp monthly candle and moves away quickly from its base area.
Therefore, if historical patterns hold true, this chart suggests that the next big move is likely to occur once the price is able to hold above the upper limit of the current consolidation-which signals the transition from the compression phase to the expansion phase on the monthly chart.
Weekly PMO Signal Hints at Potential Dogecoin Macro Lows
A Dogecoin chart shared by Bitcoinsensus highlights the Price Momentum Oscillator (PMO) indicator in the weekly time frame, which has now dropped past the white threshold line-a line considered by analysts to be a marker of a potential macro bottom.
Read also: Dogecoin Price Drops 11% Today As DOGE Active Addresses Jump 36%
In his post, the analyst mentioned that this kind of downward crossover also appears near the low of the previous major cycle, and each time it happens, it is usually followed by a longer recovery phase for prices.
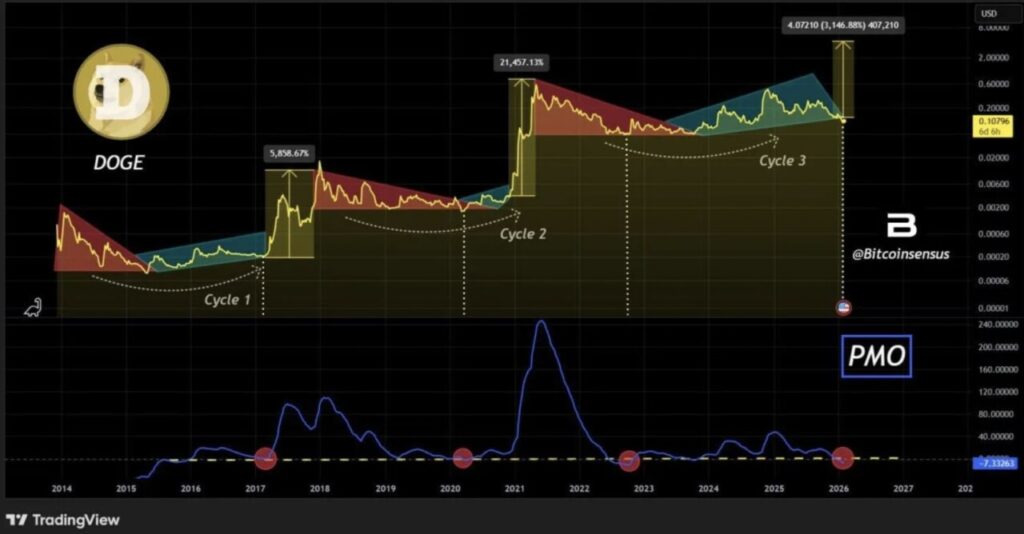
The chart divides Dogecoin’s price history into cycles, and each cycle’s low point is marked by a PMO drop that breaks the reference line. Those moments occur when the downward trend starts to slow down, then the price goes flat to form a bottom, before eventually rising again.
As such, this indicator reading indicates that the current price area may be the final stage of a downward phase, rather than the beginning of a new downward wave.
The latest signal puts Dogecoin in what analysts call a repeating bottom pattern. If the previous pattern repeats, the chart implies that the next step is likely to be price stabilization above the most recent bottom, then a gradual change in trend that develops over a matter of weeks or months-not instantly in a few days.
However, this scenario remains conditional. If there is a sustained decline after this signal, then the resemblance to the historical pattern will weaken.
Follow us on Google News to stay up to date with the latest in crypto and blockchain technology. Check Bitcoin price, usdt to idr and tokenized nvidia stock price through Pintu Market.
Enjoy an easy and secure crypto trading experience by downloading the Pintu crypto app via Play Store or App Store now. Also, experience web trading with advanced trading tools such as pro charting, various order types, and portfolio tracker only at Pintu Pro.
*Disclaimer
This content aims to enrich readers’ information. Pintu collects this information from various relevant sources and is not influenced by outside parties. Note that an asset’s past performance does not determine its projected future performance. Crypto trading activities are subject to high risk and volatility, always do your own research and use cold hard cash before investing. All activities of buying and selling Bitcoin and other crypto asset investments are the responsibility of the reader.
Reference:
- Coinpaper. Dogecoin Charts Flash Cycle Pump Setup as Weekly PMO Dips Under Macro Line. Accessed on February 6, 2026
Latest News
© 2026 PT Pintu Kemana Saja. All Rights Reserved.
The trading of crypto assets is carried out by PT Pintu Kemana Saja, a licensed and regulated Digital Financial Asset Trader supervised by the Financial Services Authority (OJK), and a member of PT Central Finansial X (CFX) and PT Kliring Komoditi Indonesia (KKI). Crypto asset trading is a high-risk activity. PT Pintu Kemana Saja do not provide any investment and/or crypto asset product recommendations. Users are responsible for thoroughly understanding all aspects related to crypto asset trading (including associated risks) and the use of the application. All decisions related to crypto asset and/or crypto asset futures contract trading are made independently by the user.