Bitcoin Slides to $69,000 as Analysts Warn a Potential Peak May Be Forming
Jakarta, Pintu News – Bitcoin traders are highlighting two opposing scenarios: one anticipates a monthly pullback low forming, while the other expects one last intraday upside push before a short-term top is reached.
Analyst X, Trader Tardigrade, thinks that Bitcoin (BTC) may have hit bottom after a breakdown in the monthly RSI. On the other hand, Analyst X, More Crypto Online observed that the wave structure on the 15-minute time frame still has the potential to form one more rise towards the $73,800 range to complete the five-wave bull pattern.
Then, how will the Bitcoin price move today?
Bitcoin Price Drops 3.07% in 24 Hours
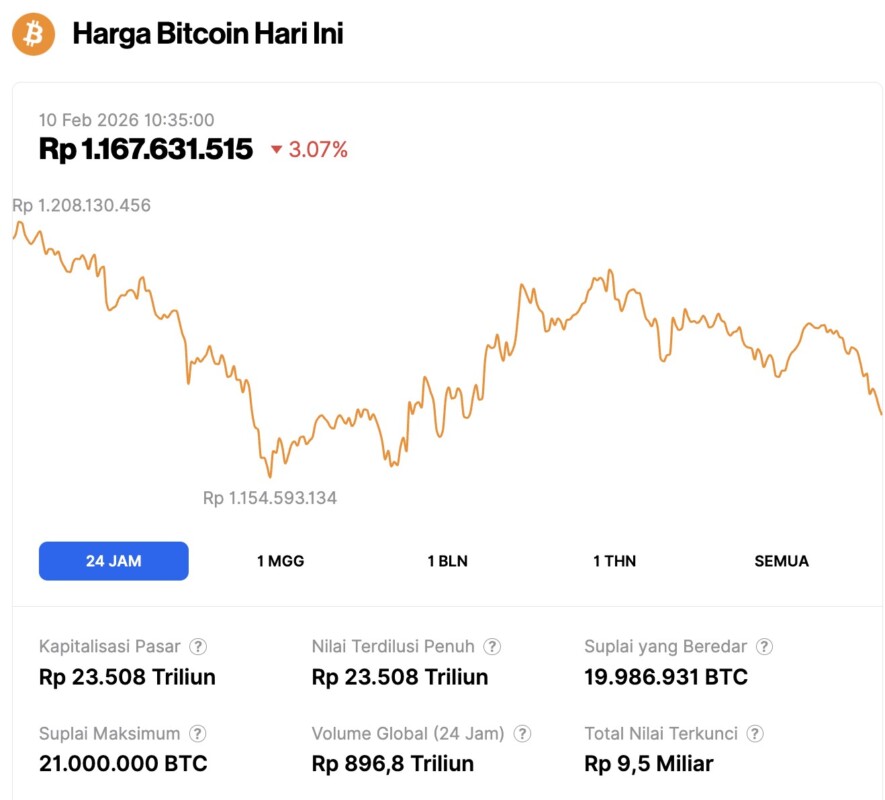
On February 10, 2026, Bitcoin was trading at $69,334, equivalent to IDR 1,167,631,515, marking a 3.07% decline over the past 24 hours. During this period, BTC hit a low of IDR 1,154,593,134 and climbed as high as IDR 1,208,130,456.
At the time of writing, Bitcoin’s market capitalization is around IDR 23,508 trillion, while its 24-hour trading volume has increased by 19% to approximately IDR 896.8 trillion.
Read also: Bitcoin Stumbles, Crypto Futures Trading Volume in Russia Skyrockets!
Analysts Say Bitcoin Correction Has Likely Reached the Bottom
Bitcoin may have hit the lowest level of its latest pullback phase after a breakdown in the relative strength index (RSI) indicator on the monthly time frame, according to crypto trader Trader Tardigrade, who goes by @TATrader_Alan on the X platform.
In a chart he shared, BTCUSD’s monthly price movement is seen to be in a series of what he calls “impulsive moves” which are then followed by “pullbacks”. The chart highlights the previous two “RSI breakdown” moments and marks each pullback phase as lasting for “12 bars,” or roughly 12 months on the monthly time frame.
Trader Tardigrade writes that Bitcoin “may have reached the bottom of its current pullback over the past 12 months” following an RSI breakdown. He adds that “the next impulsive move is imminent,” and packages this scenario as a potential transition from a pullback phase back to a trend-directed move on the monthly chart.
Read also: Key Events Set to Shake Up the Crypto Market This Week
Another Analyst Sees a Potential Peak in Bitcoin Prices
Bitcoin may have formed a short-term price peak in wave 5 of (3), according to market analyst More Crypto Online, who goes by @Morecryptoonl on the X platform.
In the TradingView chart labeled BTCUSD on the 15-minute time frame, he mapped out the Elliott Wave structure and explained that the latest upward push could already be the peak of the current rally. However, he mentioned that he still wants to see one more bounce to confirm a clean five-wave pattern to the upside. The $73,800 level is cited as the ideal area for that final push.
The chart also shows that the price is starting to hold near the local resistance zone, while still above the ascending support line formed from the latest low. This structure hints that the momentum is starting to slow down after a strong rebound.
At the same time, the wave count places the market in the final phase of the current series, increasing the risk of a pause or correction if the next push fails to continue higher.
The Fibonacci retracement zones on the chart mark the immediate downside areas if the price reverses. The 23.6% level is around $69,720, followed by the 38.2% level around $68,535 and the 50% level around $67,593. These zones serve as potential areas for price reaction in a short-term retracement scenario before the larger structure finds its next direction.
Follow us on Google News to stay up to date with the latest in crypto and blockchain technology. Check Bitcoin price, usdt to idr and tokenized nvidia stock price through Pintu Market.
Enjoy an easy and secure crypto trading experience by downloading the Pintu crypto app via Play Store or App Store now. Also, experience web trading with advanced trading tools such as pro charting, various order types, and portfolio tracker only at Pintu Pro.
*Disclaimer
This content aims to enrich readers’ information. Pintu collects this information from various relevant sources and is not influenced by outside parties. Note that an asset’s past performance does not determine its projected future performance. Crypto trading activities are subject to high risk and volatility, always do your own research and use cold hard cash before investing. All activities of buying and selling Bitcoin and other crypto asset investments are the responsibility of the reader.
Reference:
- Coinpaper Bitcoin Price Prediction: Will $73,800 Mark the Rally’s Final Wave? Accessed on February 10, 2026
Latest News
© 2026 PT Pintu Kemana Saja. All Rights Reserved.
The trading of crypto assets is carried out by PT Pintu Kemana Saja, a licensed and regulated Digital Financial Asset Trader supervised by the Financial Services Authority (OJK), and a member of PT Central Finansial X (CFX) and PT Kliring Komoditi Indonesia (KKI). Crypto asset trading is a high-risk activity. PT Pintu Kemana Saja do not provide any investment and/or crypto asset product recommendations. Users are responsible for thoroughly understanding all aspects related to crypto asset trading (including associated risks) and the use of the application. All decisions related to crypto asset and/or crypto asset futures contract trading are made independently by the user.