Aster (ASTER) Price Prediction: Rebound Stuck in Supply Zone, Leverage Continues to Shrink!
Jakarta, Pintu News – Aster (ASTER) is currently trying to stabilize after a sharp decline, with prices bouncing off the swing low at $0.406. This recovery pushes ASTER back into the $0.62-$0.63 range, an area that traders are watching closely. This zone coincides with a major Fibonacci retracement level and a previous supply region.
As a result, the area is a short-term obstacle that is still holding back the price increase. Market data suggests that this movement reflects more of a stabilization phase than a clear change in trend. Therefore, traders should remain cautious as long as the price remains below the confirmed breakout level.
Recovery Efforts Stifled by Resistance
Price action on the 4-hour chart (9/2) shows ASTER repeatedly stuck below the $0.65 area. This level aligns with the 0.618 Fibonacci retracement and some previous rejection points.
Read also: Solana Price Prediction: SOL holds at $87 after 20% rally despite ETF fund flight
Importantly enough, the zone has been successfully defended several times by sellers, so further gains are limited. Above it, there is a stronger resistance zone in the range of $0.71-$0.72, which was the initial area of the big drop. Breaking out of this area will require a consistent buying push as well as support from broader market sentiment.
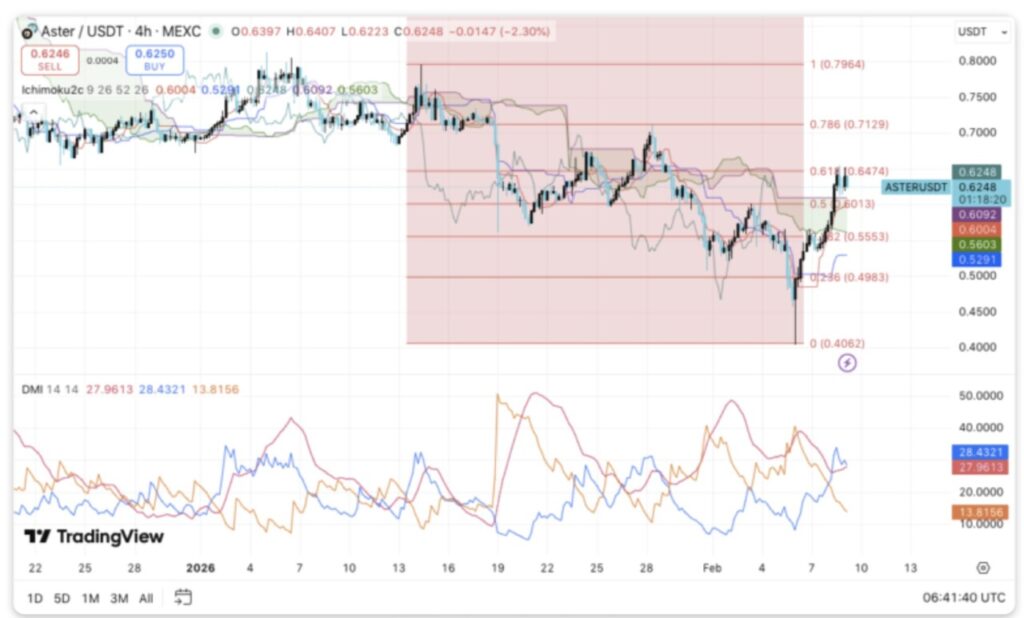
On the Ichimoku indicator, ASTER has moved up close to the cloud but has not managed to break through it. The cloud is still thick above the price signaling that selling pressure remains strong from the upside.
The Kijun-sen around $0.61 is now the immediate support, while the Tenkan-sen in the $0.60 area reflects the short-term balance. However, the price needs to hold above the cloud to confirm a bullish trend change. As long as this does not happen, the price structure still points to a corrective recovery.
Momentum indicators also support a cautious view. The Directional Movement Index shows that the bullish momentum has started to weaken, with the positive directional strength reversing downwards. On the other hand, the ADX is still high indicating that the previous trend is still a strong influence on the current price movement.
As a result, this recovery rally still seems fragile without any new momentum boost. A strong 4-hour candle close above $0.65 could revive buying interest. Conversely, failure to break the resistance increases the risk of a downside correction towards $0.60 or even $0.55.
Derivative and Spot Data Show Stabilization Phase
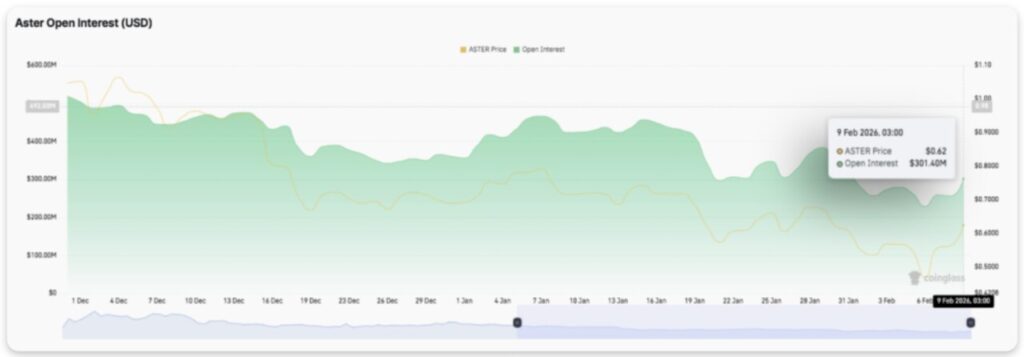
Open interest trends provide additional context. Derivatives data showed a consistent contraction from early December to late January. Open interest fell from above $450 million to around $300 million as prices declined.
This pattern suggests that traders are reducing leverage exposure rather than aggressively opening new positions. In addition, open interest has stabilized at around $300 million during the latest phase of price increases. This stability indicates that market participants are waiting for a clearer direction before reallocating capital.
The spot flow data gives a slightly more positive signal. ASTER had previously experienced sustained selling pressure, reflected in the net outflows that continued until the end of 2025. However, the selling intensity started to subside when entering early 2026.
Read also: Analyst: XRP price set to plummet below $1 before flying to $10, how come?
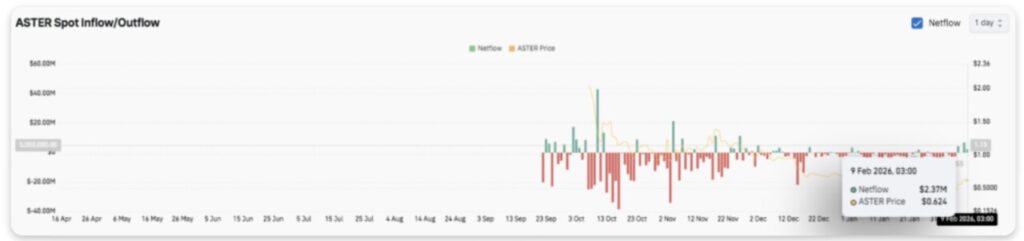
Later, fund flows turned slightly positive, with net inflows of around $2.37 million. This shift indicates accumulation interest in the lower price area. Although the value of inflow is still limited, it signals that downward pressure is starting to ease and market balance is slowly improving.
Aster (ASTER) Technical Outlook
Aster’s key levels are still clearly visible as the price moves in an important decision area. Currently, ASTER is still holding above the short-term support, but the supply pressure in the upper area remains strong, so the price movement structure tends to be neutral rather than cautious.
Upside level:
The nearest resistance is in the range of $0.65-$0.67, an area that has been a point of rejection several times. If ASTER is able to break and confirm a break above this zone, upside room could open up towards $0.71-$0.72, which is the previous breakdown area as well as a deeper Fibonacci retracement level.
Above that, sustained momentum could potentially push prices towards the $0.78 area, although this scenario requires stronger volumes and clearer trend confirmation.
Downside levels:
On the downside, the $0.60-$0.61 area is the first support, supported by the previous consolidation zone and the short-term trend structure. If this area is broken, the downside risk is likely to widen to $0.55-$0.56, and further towards $0.50 which represents the last higher low structure of the latest recovery rally.
Main resistance limit:
The zone around $0.65 stands out as a crucial level that needs to be taken over to support the continuation of the short-term bullish bias. The price is also still below the thicker part of the Ichimoku cloud, which signals the current movement is more like a recovery phase rather than a full trend reversal. A close above this area would improve the medium-term outlook.
Overall, the technical picture shows ASTER is entering a compression phase after a sharp rally, with momentum starting to slow down. Stabilizing open interest and improving spot fund flows indicate downside pressure is easing, but market conviction remains limited.
As such, future volatility expansion is likely to depend on a decisive break of the current price movement range.
Follow us on Google News to stay up to date with the latest in crypto and blockchain technology. Check Bitcoin price, usdt to idr and tokenized nvidia stock price via Pintu Market.
Enjoy an easy and secure crypto trading experience by downloading the Pintu crypto app via Play Store or App Store now. Also, experience web trading with advanced trading tools such as pro charting, various types of order types, and portfolio tracker only at Pintu Pro.
*Disclaimer
This content aims to enrich readers’ information. Pintu collects this information from various relevant sources and is not influenced by outside parties. Note that an asset’s past performance does not determine its projected future performance. Crypto trading activities are subject to high risk and volatility, always do your own research and use cold hard cash before investing. All activities of buying and selling Bitcoin and other crypto asset investments are the responsibility of the reader.
Reference:
- CoinEdition. Aster (ASTER) Price Prediction: ASTER Rebound Meets Supply Zone as Leverage Continues to Drop. Accessed on February 10, 2026
Latest News
© 2026 PT Pintu Kemana Saja. All Rights Reserved.
The trading of crypto assets is carried out by PT Pintu Kemana Saja, a licensed and regulated Digital Financial Asset Trader supervised by the Financial Services Authority (OJK), and a member of PT Central Finansial X (CFX) and PT Kliring Komoditi Indonesia (KKI). Crypto asset trading is a high-risk activity. PT Pintu Kemana Saja do not provide any investment and/or crypto asset product recommendations. Users are responsible for thoroughly understanding all aspects related to crypto asset trading (including associated risks) and the use of the application. All decisions related to crypto asset and/or crypto asset futures contract trading are made independently by the user.