Ethereum Holds $2,000 as Z-Score Plummets – Is $2,100 the Key Break Point?
Jakarta, Pintu News – Ethereum’s MVRV Z-score has dropped into the “capitulation zone,” according to analyst Joao Wedson who shared an Alphafractal chart dated Feb. 9.
The shared chart displays the Ethereum price in black and the MVRV Z-score in blue, a metric that compares market value to realized value and then standardizes the difference between the two.
Then, how will the Ethereum (ETH) price move today?
Ethereum Price Drops 3.79% in 24 Hours
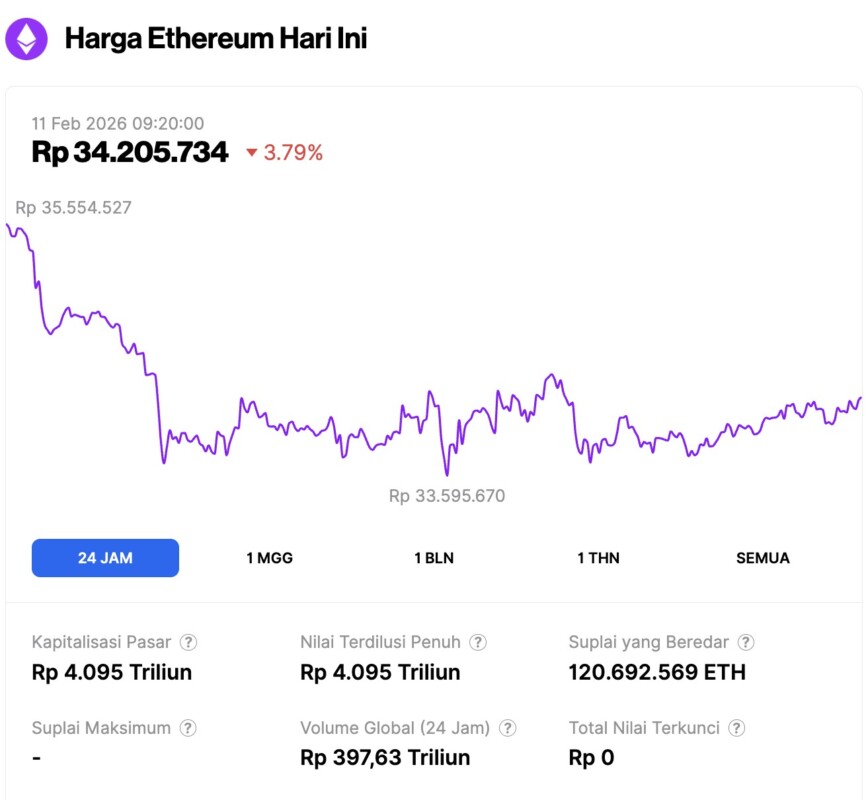
On February 11, 2026, Ethereum was trading at around $2,027, or roughly IDR 34,205,734, marking a 3.79% decline over the past 24 hours. Within that same period, ETH slipped to an intraday low of IDR 33,595,670 and climbed as high as IDR 35,554,527.
At the time of writing, Ethereum’s market capitalization is hovering around IDR 4,095 trillion, while its daily trading volume has dropped about 6%, settling near IDR 397.63 trillion over the last 24 hours.
Read also: 3 Majot Token Unlocks to Watch in the Second Week of February 2026!
Ethereum enters the “capitulation zone”
Analyst Wedson mentioned that ETH’s most recent low was at -0.42. He also highlighted the deepest low ever recorded, -0.76, which he said occurred in December 2018. As such, he sees the current decline as a clear sign of pressure, although still not as intense as the bottom phase of the great cycle in 2018 and 2022.
The chart shows previous periods of capitulation when the Z-score fell below zero and remained depressed over a long period of time. On the other hand, the peaks of previous cycles coincided with sharp Z-score spikes, which occurred during rapid price increases. This contrast is the reason why the indicator is more often used as a gauge of the level of valuation pressure, rather than a short-term timing tool.
Wedson describes capitulasI as a process, not a single moment. According to him, the market often attempts a rebound which then fails, then slowly moves lower as weaker market participants exit and volatility clears positions.
However, he added that history suggests this metric could still drop deeper into negative territory before a structural bottom is established.
In the latest reading, the Z-score is again near the lower boundary, while the price is still well above the lows seen on the long-term chart. The combination supports the main point: Ethereum is indeed showing pressure on-chain, but the data so far has not reflected the most extreme “washout” phase as in previous cycles.
Read also: Dogecoin Meme Coin Price Prediction: Whale Crypto Buys 250 Million DOGE Tokens!
Ethereum chart highlights 2.1K level as important line
Ethereum’s ETHUSD chart shows price is testing the long-monitored $2,100 area after a sharp decline, based on a TradingView snapshot shared by Daan Crypto Trades on X.
The analyst explained that the $2.1K zone has served as an important level “for the past few years” and added that bulls need to reclaim this area for the relief bounce to continue.
On the chart dated Feb. 9, ETH was seen opening around $2,038, briefly rising to approximately $2,101, then dropping to the $2,011 range before finally closing near $2,083. The movement kept the price below the $2.1K level after the session’s attempt to break back above it failed to hold.
When viewed on a longer time scale, the same chart shows repeated price reactions in the low $2,000 range of the previous move, with many bounces and breakdowns concentrated around that band.
Above that, there are also some higher resistance zones, including a wider area in the mid $2,000 range as well as the previous range in the low $3,000 range, which the price needs to break before it can approach the 2021 peak marked at the top of the chart again.
Daan Crypto Trades is positioning the $2.1K line as a short-term decision point. If the price manages to reclaim the level and hold above it, the move supports the view that yesterday’s drop only reset the range, not break it.
But if it fails to recapture, the current bounce remains fragile and ETH will continue to trade below levels that the market has repeatedly treated as important pivot points.
Follow us on Google News to stay up to date with the latest in crypto and blockchain technology. Check Bitcoin price, usdt to idr and tokenized nvidia stock price through Pintu Market.
Enjoy an easy and secure crypto trading experience by downloading the Pintu crypto app via Play Store or App Store now. Also, experience web trading with advanced trading tools such as pro charting, various order types, and portfolio tracker only at Pintu Pro.
*Disclaimer
This content aims to enrich readers’ information. Pintu collects this information from various relevant sources and is not influenced by outside parties. Note that an asset’s past performance does not determine its projected future performance. Crypto trading activities are subject to high risk and volatility, always do your own research and use cold hard cash before investing. All activities of buying and selling Bitcoin and other crypto asset investments are the responsibility of the reader.
Reference:
- Coinpaper. Ethereum Price Prediction: $2,100 Critical as Z Score Drops. Accessed on February 11, 2026
Latest News
© 2026 PT Pintu Kemana Saja. All Rights Reserved.
The trading of crypto assets is carried out by PT Pintu Kemana Saja, a licensed and regulated Digital Financial Asset Trader supervised by the Financial Services Authority (OJK), and a member of PT Central Finansial X (CFX) and PT Kliring Komoditi Indonesia (KKI). Crypto asset trading is a high-risk activity. PT Pintu Kemana Saja do not provide any investment and/or crypto asset product recommendations. Users are responsible for thoroughly understanding all aspects related to crypto asset trading (including associated risks) and the use of the application. All decisions related to crypto asset and/or crypto asset futures contract trading are made independently by the user.