Gold Price in the Last 5 Years: Charts, Trends, & Analysis of 2021-2026 Movements
Jakarta, Pintu News – Over the past five years, gold prices (XAU/USD) have shown a strong upward trend in line with rising safe-haven demand and global economic dynamics. The gold price chart over the period 2021-2026 reflects several strong market phases influenced by inflation, monetary policy, as well as economic uncertainty. Tracing movements over the long term helps investors understand the current price context and the broader fundamental outlook.
Key Trends of Gold Price in the Last 5 Years
Five-year gold price chart data shows that the precious metal has experienced a significant rise since early 2021. Around the beginning of 2021, gold prices were at around USD1,940 per ounce, while by the end of 2025 prices were already much higher and even peaked at over USD4,500 per ounce in December 2025 according to some historical chart sources. During this period, gold made large percentage gains reflecting an increase of more than 100 percent in the last five years, signaling volatility and a long-term bullish trend.
This movement is observed through historical charts that show that gold has touched five-year highs when global macroeconomic conditions are under pressure, such as high inflation and market uncertainty. Investors tend to turn to gold to hedge their portfolios when other risky assets, such as stocks, show sharp corrections.
Read More: Silver Price Projections 2026 Based on J.P. Morgan Outlook
Catalyst Factors Behind the Surge in Gold Prices
The rise in gold prices over the past five years is not just a statistical phenomenon, but occurred due to a number of fundamental factors, including loose monetary policy at the beginning of the period and prolonged geopolitical uncertainty. When major central banks keep interest rates low or even release large stimulus, gold tends to rise due to its attractiveness as a hedge against inflation. Recent data shows that in 2026 gold prices remained high despite short-term fluctuations in the market.
In addition, the global market correction and the shift of capital flows to defensive assets also put positive pressure on gold prices. In some cases, the gold market recorded new record highs, especially when investors were looking for relatively stable assets in volatile conditions in the stock market.
Price Movement Patterns and Volatility
A five-year gold price chart reveals that the precious metal is not only experiencing a linear uptrend, but also a corrective phase. Correction periods usually occur when the US dollar strengthens or when the market offers attractive yields through other instruments such as high-yield bonds. Such conditions often lead to a temporary decline in gold prices before rebounding again when risk sentiment improves.
This volatility is seen during key periods such as times of global recession, unexpected monetary policy or significant geopolitical events. Although gold prices sometimes fall short-term, the long-term trend still depicts significant gains in the past five years.
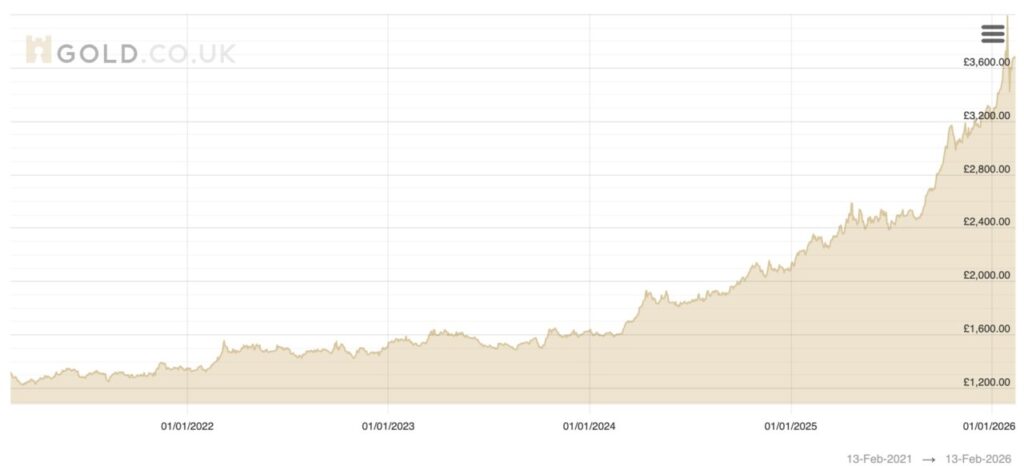
5 Year Gold Price Chart in the World
Globally, the five-year gold price chart shows a uniform pattern across major currency denominations. The five-year chart for gold prices in the UK and Europe also shows an upward trend of more than 150 percent from the low point five years ago, as well as a range of highs that are much higher than the starting point of the period. This suggests that gold’s movements are not a regional phenomenon, but a global one, influenced by economic conditions and international investor demand.
This chart data shows how gold acts as an attractive portfolio diversification instrument and remains relevant even in an era of high market volatility. Trading gold through futures contracts, ETFs or physical holdings remains a popular way to gain exposure to the metal over a long-term period.
Implications for Long-Term Investors
Analyzing the gold price chart of the past five years is important for investors considering long-term asset allocation. The consistent upward trend shows that gold remains an effective hedge against inflation and economic uncertainty. Long-term investors can use this historical chart to evaluate potential entry and exit points and understand the volatility risks inherent in this commodity.
Overall, the gold price chart for the past five years clearly illustrates that the precious metal has historically performed strongly. Despite short-term volatility, gold’s long-term upside potential remains relevant as a strong portfolio diversification instrument and hedge against global economic turmoil.
Also Read: 3 Scenarios of Martabe Gold Mine & Its Impact on Crypto: Price Could Reach Rp84 Million per Ounce?
Follow us on Google News to stay up to date with the latest crypto and blockchain technology. Check Bitcoin price, USDT to IDR and Nvidia stock price tokenized via Pintu Market.
Enjoy an easy and secure crypto trading experience by downloading the Pintu crypto app via Play Store or App Store now. Also, experience web trading with advanced trading tools such as pro charting, various order types, and portfolio tracker only at Pintu Pro.
Gold-Based Crypto: When Physical Assets Meet Crypto Technology

As blockchain technology develops, gold can now be owned not only in physical form such as jewelry or bars, but also in digital form through gold-based crypto assets.
One of the most popular is Tether Gold (XAUt), a physical gold-backed ERC-20-based stablecoin, where 1 token represents 1 troy ounce of pure gold. The gold is stored in vaults in Switzerland and each token is directly linked to certified gold bullion. The system uses automated algorithms to efficiently manage the allocation of gold and Ethereum addresses.
XAUt tokens are available and traded on various crypto exchanges. XAUt is also an attractive alternative for those looking to hedge against inflation or global economic uncertainty, while remaining within the digital asset ecosystem.
*Disclaimer
This content aims to enrich readers’ information. Pintu collects this information from various relevant sources and is not influenced by outside parties. Note that an asset’s past performance does not determine its projected future performance. Crypto trading activities are subject to high risk and volatility, always do your own research and use cold hard cash before investing. All activities of buying and selling Bitcoin and other crypto asset investments are the responsibility of the reader.
Reference
- Gold.co.uk. 5 Year Gold Price Chart. Accessed February 13, 2026.
Latest News
© 2026 PT Pintu Kemana Saja. All Rights Reserved.
The trading of crypto assets is carried out by PT Pintu Kemana Saja, a licensed and regulated Digital Financial Asset Trader supervised by the Financial Services Authority (OJK), and a member of PT Central Finansial X (CFX) and PT Kliring Komoditi Indonesia (KKI). Crypto asset trading is a high-risk activity. PT Pintu Kemana Saja do not provide any investment and/or crypto asset product recommendations. Users are responsible for thoroughly understanding all aspects related to crypto asset trading (including associated risks) and the use of the application. All decisions related to crypto asset and/or crypto asset futures contract trading are made independently by the user.