These 3 Altcoins Have the Potential for a Strong Rebound After February 2026
Jakarta, Pintu News – As the market moves further into a phase of extreme fear, the usual pattern of sentiment bottoming out is starting to return. For those unfamiliar, this is when a number of assets appear to be irrationally discounted when compared to their own structure and technical fundamentals.
With the price of Bitcoin (BTC) briefly hovering around $66,310, there are three altcoins that are showing what could be called a “Valentine’s Day Discount.” Not that these assets are actually “cheap,” but rather that they offer the most attractive risk-to-reward ratio. It’s not that these assets are actually “cheap,” but rather that they offer the most attractive risk-to-reward ratio in the current market conditions.
In this analysis, the CCN website reveals crypto predictions that are worth keeping an eye on.
Hedera (HBAR)
Hedera (HBAR) looks to be one of the most “clean” structured altcoins at the moment. After losing the $0.10 level and dropping to the $0.09 area, the price is now in a zone that has historically attracted long-term buyers. Not because the chart is already showing a clear bullish signal, but because the selling pressure is starting to appear weak or exhausted.
Read also: Peter Brandt’s Prediction: Bitcoin Ready to Rebound, Gold Threatened to Lose $4,000!
The key factor is the positioning of the derivatives market: the data shows a fairly dense buildup of short positions around the $0.114 level.
If HBAR is able to reclaim the $0.10 level, this could spell trouble for bearish market participants. This is where the narrative of a potential short squeeze comes in, which could push the price to move quickly towards the $0.12 area.
Throughout the last downtrend, HBAR’s funding rate was predominantly negative, accompanied by a deep red spike when the price slumped from around $0.12 to around $0.095. This shows consistent short position aggressiveness, where traders are willing to pay to maintain bearish exposure when prices weaken.
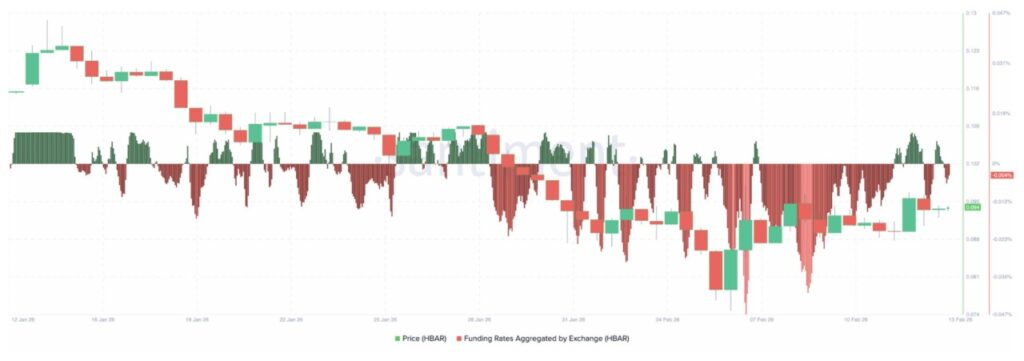
The increasingly negative correlation between falling prices and funding reflects a market that is clearly in risk-off mode.
On a brief recovery attempt in early February, funding briefly turned positive or neutral. However, the phase was short-lived and returned to negative territory when the price failed to break higher.
This pattern indicates that any upside tends to be utilized for selling, rather than aggressive accumulation. Recently, funding has started to move slightly towards neutral as prices stabilize around $0.095.
When the funding starts to “compress” after a period of extreme negativity, it can be a sign that most of the aggressive short positions are already in the market and the downward momentum is starting to slow down. However, stabilization alone is not enough to confirm a trend reversal. Prices still need to break a series of lower highs for the market structure to really change significantly.
Pump.fun (PUMP)
Pump.fun (PUMP) has been in a clear macro downtrend since reaching a blow-off peak around 0.009, characterized by a lower high and lower low pattern. Even so, PUMP is one crypto that has the potential to perform well after Valentine’s Day.
The descending channel structure is still maintained, where each rally always fails to break through the previous resistance area. Currently, the price is moving slightly above the main horizontal support at $0.0017, a level that has been the “floor” of the price movement several times.
The latest structure shows a smaller descending wedge that is compressing towards the support zone. Compression patterns like this after a long decline are often the trigger for volatility spikes.
However, the big trend remains bearish until the price manages to reclaim higher resistance – especially the $0.0028-$0.0034 area, which also coincides with the 0.236 Fibonacci level at $0.00338. If that zone is successfully broken and defended, then there could be a more meaningful change in structure.
Chart projections suggest a potential move towards $0.0034, which roughly translates to an increase of around 60-70% from current levels. While technically possible given that prices are very “compressed,” this scenario would likely require a breakout from the descending channel as well as a consistent increase in volume.
Without such confirmation, any bounce still risks just being acountertrend rally within a largerdowntrend.
Read also: Zora Expands into Solana: Features Trend Speculation Amid SOL Optimism to Break $500!
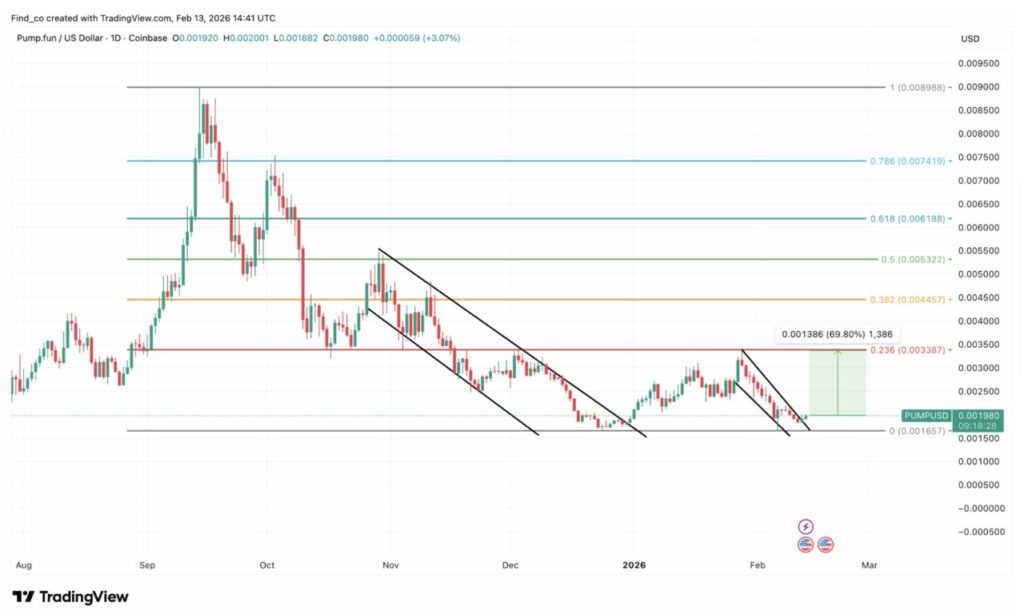
In essence, PUMP is at crucial support with compression taking shape. A breakout above the latest lower-high trend line could trigger a sharp recovery rally. But as long as no higher high is formed, the dominant structure remains bearish, so any rally should be treated with caution.
Stellar (XLM)
Stellar (XLM) price is still moving inside the descending channel on the daily timeframe, with a consistent pattern of lower highs and lower lows. The price is currently slightly above the major horizontal support at 0.137, which is also in line with the lower boundary of the channel.
This area is technically important, as repeated tests of channel support often trigger two possibilities: a downward break or a relief bounce. If the price manages to break the downtrend line, then the 0.236 Fibonacci level around $0.24 and the 0.382 level around $0.30 are the upside targets to watch.
Until that happens, the dominant structure remains bearish. So far, every rally has been held at the lower peak inside the channel, confirming that sellers still control the direction of the movement.
In terms of momentum, the AO indicator is still in negative territory, but has started to showcontracting, indicating downward pressure is slowing. This is not enough to confirm a trend reversal, but increases the chances of a short-term bounce from the support area.
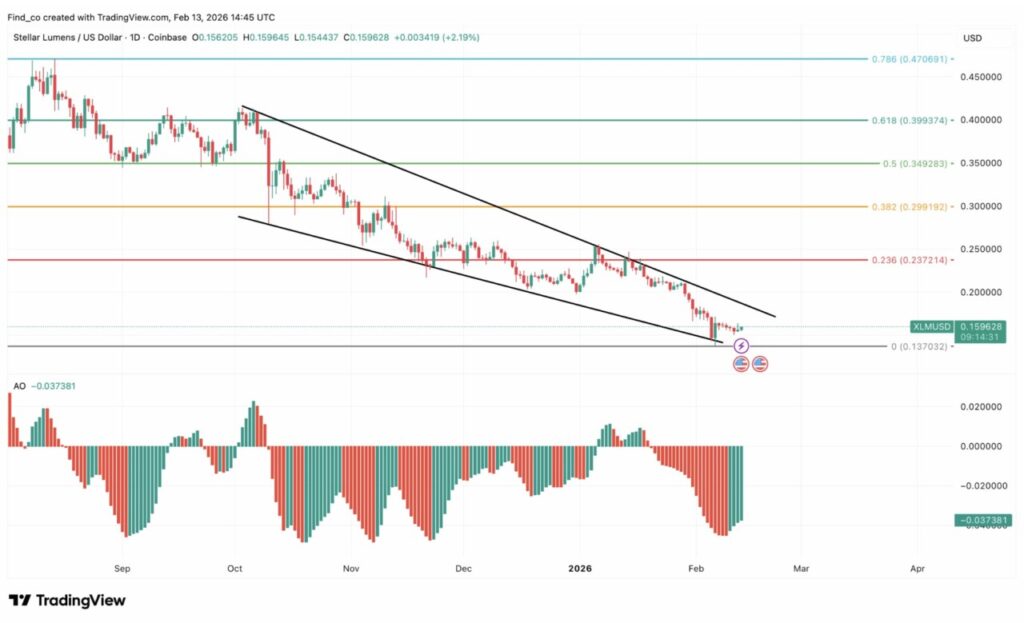
In conclusion, XLM is in a crucial decisive zone. If it is able to hold around $0.14, XLM could potentially experience a relief rally towards the resistance in the center of the channel.
If that scenario occurs, XLM could be one of the coins that performs positively as highlighted in the Valentine’s Day-themed crypto predictions. However, in the event of a confirmed break below that level, it is likely that the price opens up opportunities to resume its next decline. The trend remains bearish until the upper trendline of the channel is convincingly recaptured.
Follow us on Google News to stay up to date with the latest in crypto and blockchain technology. Check Bitcoin price, usdt to idr and tokenized nvidia stock price via Pintu Market.
Enjoy an easy and secure crypto trading and crypto gold investment experience by downloading the Pintu crypto app via Play Store or App Store now. Also, experience web trading with advanced trading tools such as pro charting, various order types, and portfolio tracker only at Pintu Pro.
*Disclaimer
This content aims to enrich readers’ information. Pintu collects this information from various relevant sources and is not influenced by outside parties. Note that an asset’s past performance does not determine its projected future performance. Crypto trading activities are subject to high risk and volatility, always do your own research and use cold hard cash before investing. All activities of buying and selling Bitcoin and other crypto asset investments are the responsibility of the reader.
Reference:
- CCN. Looking for a Valentine’s Day Discount? These 3 Altcoins Offer February 2026 Rebound Setups. Accessed on February 20, 2026
Latest News
© 2026 PT Pintu Kemana Saja. All Rights Reserved.
The trading of crypto assets is carried out by PT Pintu Kemana Saja, a licensed and regulated Digital Financial Asset Trader supervised by the Financial Services Authority (OJK), and a member of PT Central Finansial X (CFX) and PT Kliring Komoditi Indonesia (KKI). Crypto asset trading is a high-risk activity. PT Pintu Kemana Saja do not provide any investment and/or crypto asset product recommendations. Users are responsible for thoroughly understanding all aspects related to crypto asset trading (including associated risks) and the use of the application. All decisions related to crypto asset and/or crypto asset futures contract trading are made independently by the user.