Dogecoin Slips to $0.098 Today as Technical Indicators Signal Bearish Momentum
Jakarta, Pintu News – The price of Dogecoin (DOGE) fell sharply on Thursday (19/2). Selling pressure still dominates the market, although the price had tried to hold at the psychological level of $0.10. Despite weakening in the daily period, DOGE actually still recorded an increase of 5.42% in the past week.
However, the long-term trend is less favorable. DOGE has fallen 22.4% in the last 30 days and is down 60.6%year-over-year. So, how will the Dogecoin price move today?
Dogecoin Price within 24 Hours
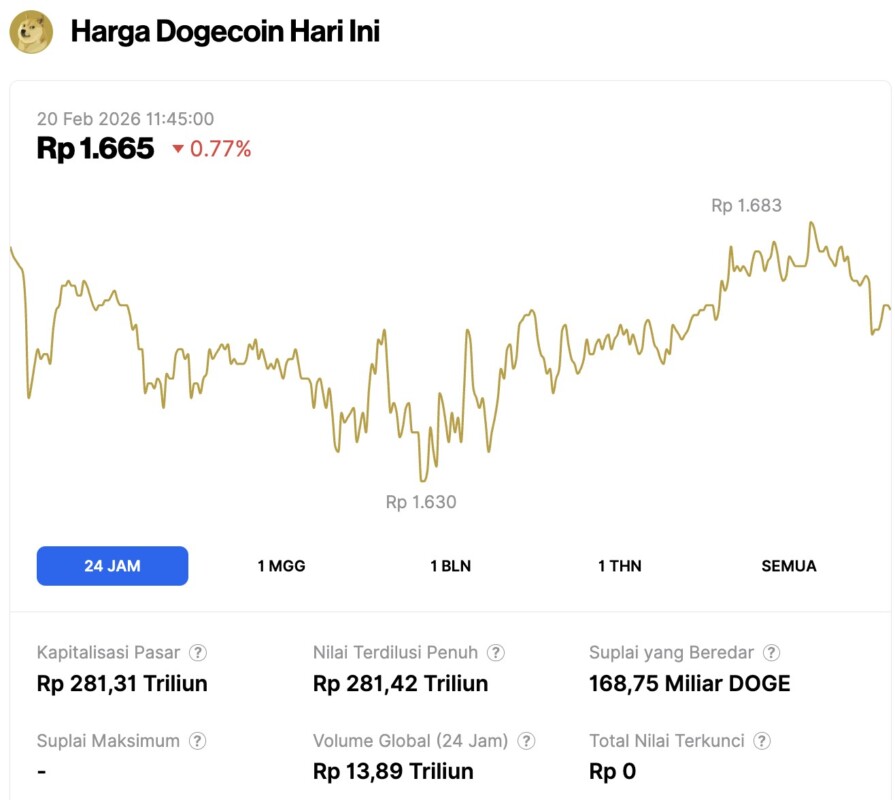
On February 20, 2026, Dogecoin slipped by 0.77% over the past 24 hours, trading at $0.09862, or roughly IDR 1,665. Throughout the daily session, DOGE fluctuated between a low of IDR 1,630 and a high of IDR 1,683.
At the time of writing, the asset’s market capitalization stands at approximately IDR 281.31 trillion, backed by a 24-hour trading volume of IDR 13.89 trillion.
Read also: As Ethereum Defends the $1,957 Mark, Whales Launch a Massive 113.6 Million ETH Buying Spree
Technical Indicators Show Bearish Momentum
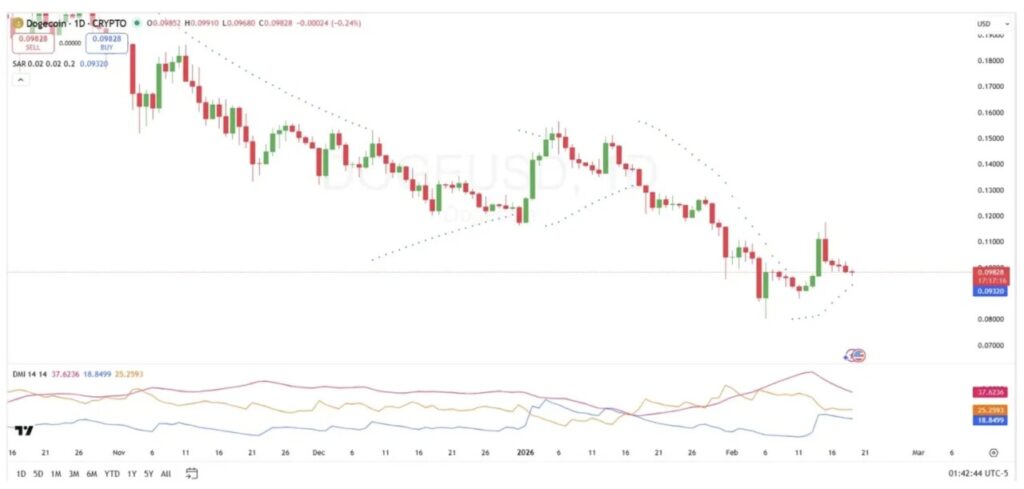
The Directional Movement Index (DMI) indicator paints a picture that calls for caution. Currently, the negative directional indicator (-DI) stands at around 37.6, well above the positive directional indicator (+DI) at 18.8.
This wide gap confirms that thesellers‘ dominance is still very strong. Meanwhile, the ADX reading of 25 indicates that the downtrend is still continuing, although it’s not at an extreme level yet.
For a potential bullish reversal to be validated, the +DI line must cross above the -DI line, which must also be accompanied by a rise in the ADX reading. The combination will confirm a momentum shift into the hands ofbuyers. Unfortunately, these two conditions have not been met.
On the other hand, there is a slightly contradictory signal from the Parabolic SAR indicator. The dots of this indicator have moved below the price candlesticks, a pattern that generally signals the start of upward momentum.
This suggests that DOGE may be attempting a relief rally (short-term recovery rally ), although the main trend is still bearish. Traders usually see this signal as an early warning of a potential trend change, although confirmation from other indicators is still required before making a decision.
Key Support and Resistance Levels
- Support: The $0.085-$0.090 area is a key zone where buyers previously held off the downside. If the price breaks below $0.085, it will open the way for further decline towards $0.080.
- Resistance: The $0.111-$0.117 area is the immediate hurdle, with a much stronger ceiling around $0.125. This level is the former breakdown point and limit of the previous lower high.
Read also: Bitcoin Rallies Toward $67K While Analysts Highlight Critical Support at 200 MA
Analysts Highlight Cup-and-Handle Formation
In a post on the X platform, crypto analyst Trader Tardigrade identified a cup-and-handle pattern on Dogecoin’s daily chart. In technical analysis, this formation is widely recognized as a signal ofbullish continuation.
According to the analyst, DOGE has completed thecup part of the pattern. The price briefly bottomed out around $0.08 before rallying back to around $0.11, forming the curved curve that characterizes this formation. Currently, DOGE seems to be entering thehandle formation phase, which is a period of consolidation near the previous high.
The decisive moment will come if DOGE is able to break out of the resistance zone at the handle area. Tardigrade traders predict that a validated breakout could trigger a surge in DOGE prices towards new highs.
However, this pattern cannot be confirmed until a breakout actually occurs and is supported by sufficient trading volume. Without strong volume, this technical formation is still just speculation.
Follow us on Google News to stay up to date with the latest in crypto and blockchain technology. Check Bitcoin price, usdt to idr and tokenized nvidia stock price through Pintu Market.
Enjoy an easy and secure crypto trading and crypto gold investment experience by downloading the Pintu crypto app via Play Store or App Store now. Also, experience web trading with advanced trading tools such as pro charting, various order types, and portfolio tracker only at Pintu Pro.
*Disclaimer
This content aims to enrich readers’ information. Pintu collects this information from various relevant sources and is not influenced by outside parties. Note that an asset’s past performance does not determine its projected future performance. Crypto trading activities are subject to high risk and volatility, always do your own research and use cold hard cash before investing. All activities of buying and selling Bitcoin and other crypto asset investments are the responsibility of the reader.
Reference:
- Coinpaper. Dogecoin Price Drops Below $0.10 as Analyst Spots Bullish Cup-and-Handle Setup on Daily Chart. Accessed on February 20, 2026
Latest News
© 2026 PT Pintu Kemana Saja. All Rights Reserved.
The trading of crypto assets is carried out by PT Pintu Kemana Saja, a licensed and regulated Digital Financial Asset Trader supervised by the Financial Services Authority (OJK), and a member of PT Central Finansial X (CFX) and PT Kliring Komoditi Indonesia (KKI). Crypto asset trading is a high-risk activity. PT Pintu Kemana Saja do not provide any investment and/or crypto asset product recommendations. Users are responsible for thoroughly understanding all aspects related to crypto asset trading (including associated risks) and the use of the application. All decisions related to crypto asset and/or crypto asset futures contract trading are made independently by the user.