Solana Price Prediction: Can SOL Survive amidst Falling Open Interest?
Jakarta, Pintu News – On February 23, 2026, the price of Solana (SOL) was briefly trading at around $77.55, having decreased by 0.12% in the last 4 hours as the token tested criticalsupport levels following President Trump’s announcement of tariff increases.
The move comes as Glassnode data shows that only 20% of Solana addresses remain in profit positions-the lowest level since November 2023-while accumulation by long-term holders has slowed drastically.
Open Interest Drops as Volume Surges due to Selling Pressure
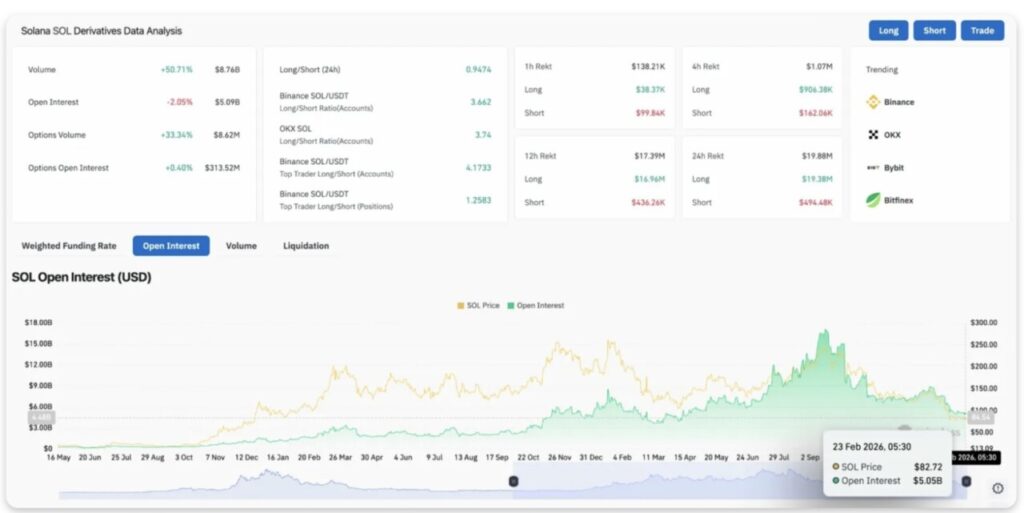
Based on data from Coinglass, Solana’s open interest (OI) fell 2.05% to $5.09 billion, while its trading volume surged 50.71% to reach $8.76 billion. Options volume also jumped 33.34% to $8.62 million, signaling that traders are bracing for continued volatility.
Read also: Vitalik Buterin Releases $7 Million Worth of ETH as Ethereum Price Plummets 30%
The long/short ratio shows an extreme bullish bias at 3.66 on Binance and 3.74 on OKX, indicating that leverage usage is still heavily skewed towards recovery despite the massive sell-off.
In contrast, top traders’ positions show $16.96 million in long positions versus $436.26 million in short positions on the 12-hour time frame. This rare short bias among large accounts suggests that they are anticipating further declines.
When open interest declines while volume surges, it usually indicatesforced liquidations rather than organic selling. Extreme long/short ratios indicate the market is expecting a recovery, but price action is moving in the opposite direction. This creates the risk of a long squeeze ifsupport levels are broken.
Price Breaks Below All Major EMAs on the Weekly Chart
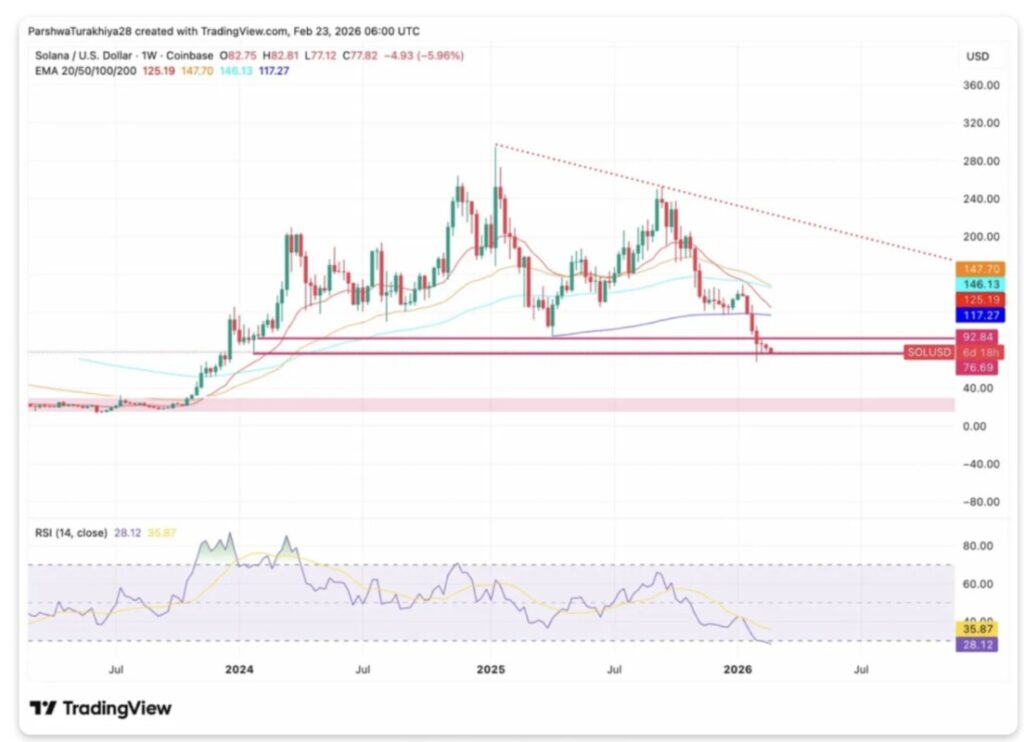
The weekly chart shows that Solana has broken below all of its majormoving averages. The 20-week EMA is at $125.19, the 50-week EMA at $147.70, the 100-week EMA at $146.13, and the 200-week EMA at $117.27. The RSI has dipped to 28.12, approachingdeeply oversold territory not seen since the bear market bottom in 2022.
The key points on the chart show:
- Netbreakdown below the entire weekly EMA.
- The RSI is at 28.12, close to the 2022 bear market lows.
- The $76.69 support zone is under immediate pressure.
- Thedescending trendline from the 2025 high remains intact.
Solana slumped from above $305 in November 2025 to a low of $67.38, marking a 78% correction. The current consolidation near $77.55 is testing whether the February low will hold, or whether the tariff shock will trigger a further decline towards thedemand zone of$67.38.
A weekly close above $117.27 is required to reclaim the 200-week EMA and mark the first major change in price momentum. Until that happens, the market structure remains decisively bearish, with sellers defending positions on every bounce attempt.
The RSI reading of 28.12 which is close to the 2022 low (16.84) indicates that the market is approachingcapitulation levels.
Only 20% of Addresses Still Making Profits
Based on Glassnode data, the percentage of Solana addresses that are in a profitable position has slipped to around 20% in February, the lowest level since November 2023. In comparison, during the previous bear market cycle, this metric bottomed out at 1.37% on December 28, 2022. This suggests that there is still significant downside potential if history repeats itself.
The Hodler net position change metric had shown a positive trend in January, indicating accumulation by long-term holders. However, this metric slowed down sharply over the past three weeks as SOL prices fell below the $100 level. This decline reflects the weakening of long-term confidence compared to the conditions in the first half of January.
The combination of deteriorating profitability and weakening accumulation suggests that long-term holders are starting to lose confidence. When less than 25% of addresses are in profit, it is usually an indicator that the market is in deep bear territory, where capitulation becomes more likely.
The current figures suggest that it may be too early to determine abottom, and analysts warn that price pressure may still continue.
Read also: 17 Reasons XRP Price Will Be Bullish According to CryptoBull Analysts
4-Hour Chart Shows Critical Support Level Testing
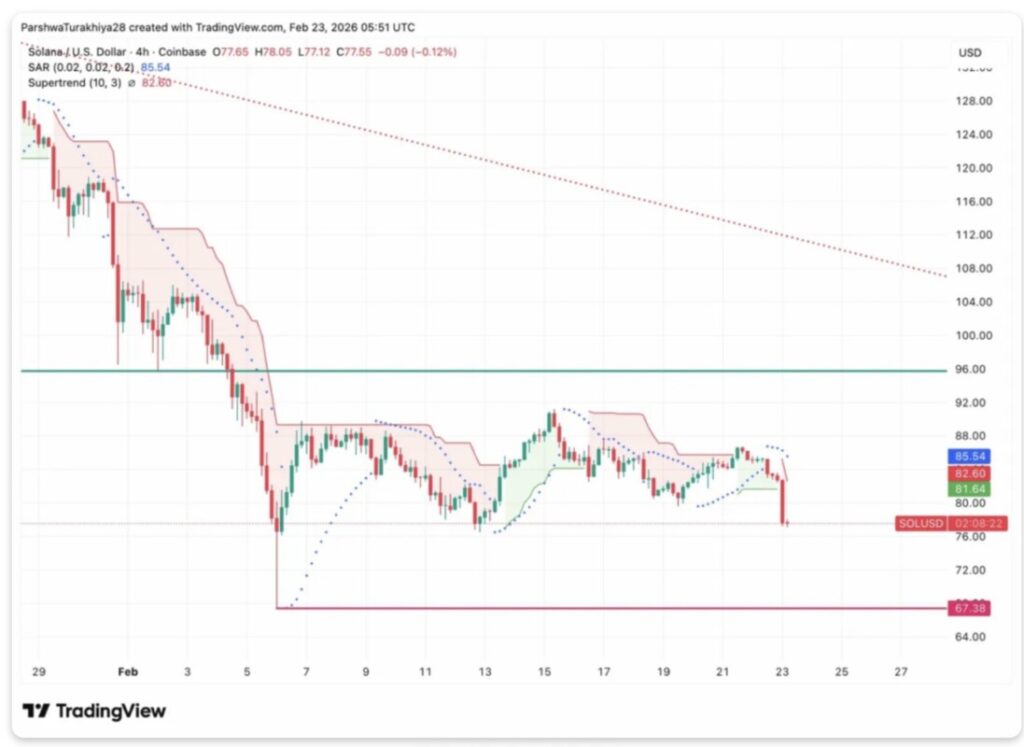
The 4-hour chart (Feb 23) reveals that Solana is testing horizontal support at $67.38, which was the February low. The Supertrend Indicator is now at $82.60 and serves as resistance after a bearish reversal. Meanwhile, the Parabolic SAR at $85.54 is the nearestoverhead resistance.
The current technical structure shows:
- The price is testing the February low of $67.38.
- The Supertrend and SAR are both in a bearish position.
- The resistance zone of $96.00 is well above the current price.
The buyers are looking to defend the $67.38 support for the second time in the last three weeks. In case of a breakdown below this level, it will register a new multi-year low and confirm the deepening of the bearish market phase. The combination of weak fundamentals, deteriorating profitability of asset holders, as well as Trump’s tariff shocks are putting immense pressure on this support zone.
Successfully reclaiming the $82.60 level will turn the Supertrend bullish and bring the $85.54 level back into the range. Without such a reversal, prices remain vulnerable to a drop towards $60 or lower, especially if low profitability figures trigger mass capitulation.
Follow us on Google News to stay up to date with the latest in crypto and blockchain technology. Check Bitcoin price, usdt to idr and tokenized nvidia stock price through Pintu Market.
Enjoy an easy and secure crypto trading and crypto gold investment experience by downloading the Pintu crypto app via Play Store or App Store now. Also, experience web trading with advanced trading tools such as pro charting, various order types, and portfolio tracker only at Pintu Pro.
*Disclaimer
This content aims to enrich readers’ information. Pintu collects this information from various relevant sources and is not influenced by outside parties. Note that an asset’s past performance does not determine its projected future performance. Crypto trading activities are subject to high risk and volatility, always do your own research and use cold hard cash before investing. All activities of buying and selling Bitcoin and other crypto asset investments are the responsibility of the reader.
Reference:
- CoinEdition. Solana Price Prediction: Can SOL Hold $67.38 As Open Interest Falls 2.05%? Accessed on February 24, 2026
Latest News
© 2026 PT Pintu Kemana Saja. All Rights Reserved.
The trading of crypto assets is carried out by PT Pintu Kemana Saja, a licensed and regulated Digital Financial Asset Trader supervised by the Financial Services Authority (OJK), and a member of PT Central Finansial X (CFX) and PT Kliring Komoditi Indonesia (KKI). Crypto asset trading is a high-risk activity. PT Pintu Kemana Saja do not provide any investment and/or crypto asset product recommendations. Users are responsible for thoroughly understanding all aspects related to crypto asset trading (including associated risks) and the use of the application. All decisions related to crypto asset and/or crypto asset futures contract trading are made independently by the user.