Bitcoin Threatened by Worst Q1 Since 2018: 3 Bear Flag Pattern Risks Lurking?
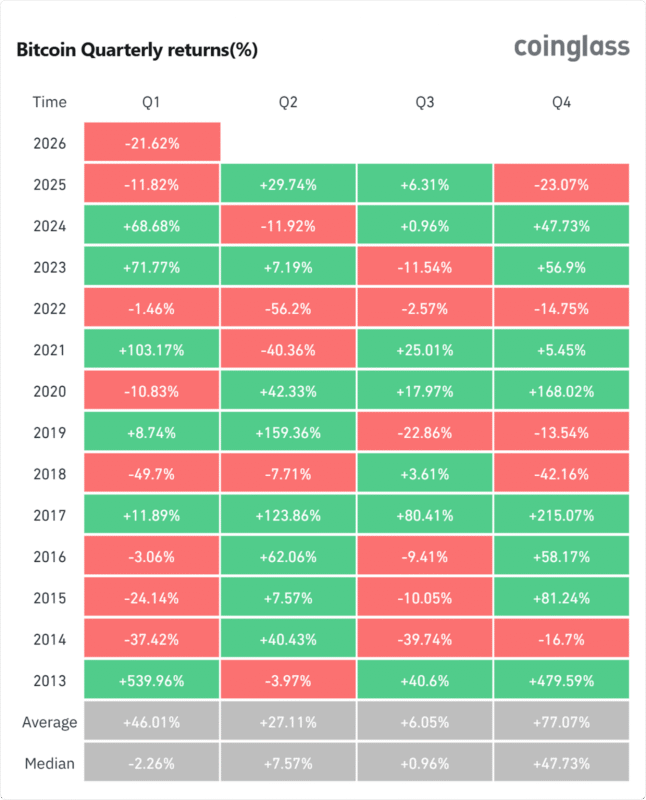
Jakarta, Pintu News – Entering the first quarter (Q1) of 2026, Bitcoin (BTC) is facing a tough challenge by recording a price drop of around 22% year-to-date. You might be worried that the major cryptocurrency asset is on track for its worst start-of-year performance in eight years, resembling the 2018 bear market.
Recent technical analysis shows the emergence of a bear flag pattern on the daily chart, which triggers a serious warning for investors regarding the potential for a much deeper price correction if key support levels fail to hold.
Bear Flag Pattern Threat and IDR986 Million Downside Target
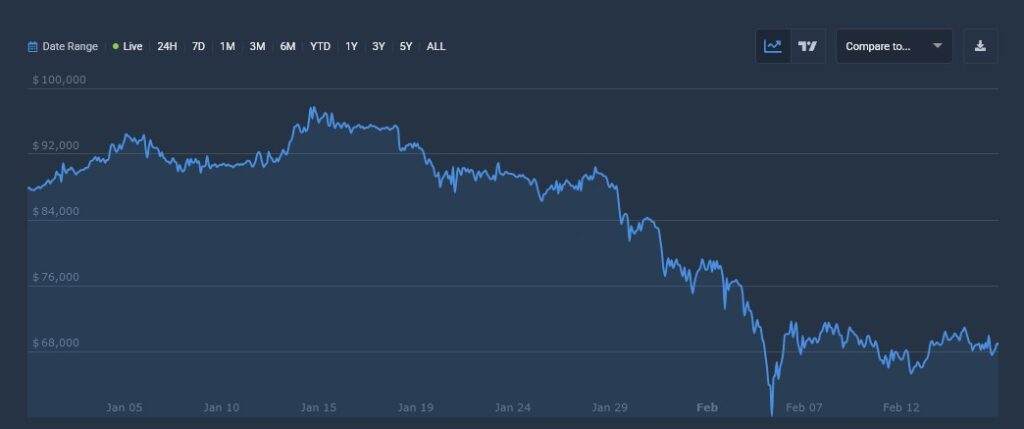
Bitcoin (BTC) price is currently trapped in a bear flag technical pattern that indicates a weak consolidation phase after experiencing a sharp price fall. You need to be cautious as confirmation of a break below the critical support level of IDR1,115,257,830 ($66,270) could activate the next downside target towards the IDR989,545,200 ($58,800) range. Analysts warn that if the selling pressure persists without a significant surge in buying volume, this bearish structure will be increasingly difficult to break in the near term.
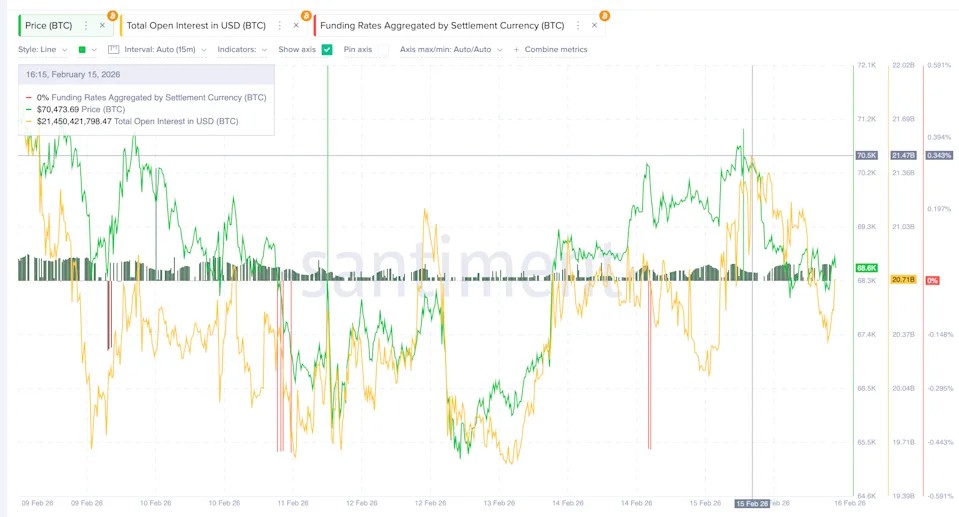
Market conditions are exacerbated by leverage data that shows overcrowdedlongs, making them vulnerable to a wave of liquidation if prices drop even slightly. You can see that a very positive funding rate means traders are aggressively chasing the bulls, which historically often leads to sudden price corrections. If the IDR986 million region is breached, the next extreme downside target for this cryptocurrency could be the IDR841,450,000 ($50,000) area by next March.
Read More: Gold Under Threat? 5 Critical Factors that Could End Gold’s 7-Month Rally
Weakening Demand and Sales by Long-Term Holders
Bitcoin’s (BTC) downside risk is becoming more evident with indications of structural demand weakness, especially from the spot ETF sector in the United States which is starting to lose steam. You should take note of on-chain data showing thatLong-Term Holders have started to accelerate their selling consistently throughout February 2026. This phenomenon signals a shift in sentiment from accumulation towards distribution, which usually characterizes the beginning of a more aggressive bear market phase.
On the other hand, the supply released by large holders is now being absorbed by short-term traders or speculative money that tends to react emotionally to volatility. You need to understand that this influx of “hot money” makes the price defense wall much more fragile and unstable than before. The lack of impetus from institutional investors is making it difficult for the crypto asset to reclaim the psychological level of IDR1,346,320,000 ($80,000) to undo the growing negative narrative.
Last Stand and Price Recovery Scenario
Although the situation looks bleak, traders are closely monitoring the Rp1,061,909,900 ($63,100) area as a key demand wall zone or last line of defense for Bitcoin. You can see that about 1.3% of the total Bitcoin supply is concentrated at this price level, which is expected to withstand further downward pressure through buying at the base price. Successfully defending this level is crucial for Bitcoin (BTC) to have a chance to make a technical rebound and stabilize the overall cryptocurrency market structure.
The recovery scenario will only be confirmed if Bitcoin is able to break back and hold above the Rp1,329,491,000 ($79,000) level to remove the existing bearish pattern. You should keep a close eye on macroeconomic data releases which may be a positive catalyst to change the sentiments of major investors in the crypto market. Always use very strict risk management and avoid using high leverage in a market that is at a crossroads towards potentially the worst Q1 loss.
Also Read: MicroStrategy Ready to Overtake Bitcoin? Check out the Shocking Predictions for the End of February!
Follow us on Google News to stay up to date with the latest crypto and blockchain technology. Check Bitcoin price, USDT to IDR and Nvidia stock price tokenized via Pintu Market.
Enjoy an easy and secure crypto trading experience by downloading the Pintu crypto app via Play Store or App Store now. Also, experience web trading with advanced trading tools such as pro charting, various order types, and portfolio tracker only at Pintu Pro.
*Disclaimer
This content aims to enrich readers’ information. Pintu collects this information from various relevant sources and is not influenced by outside parties. Note that an asset’s past performance does not determine its projected future performance. Crypto trading activities are subject to high risk and volatility, always do your own research and use cold hard cash before investing. All activities of buying and selling Bitcoin and other crypto asset investments are the responsibility of the reader.
- Peter Wind/BeInCrypto. Will Bitcoin Price Drop to US$50,000 by March 2026? Accessed February 24, 2026.
Latest News
© 2026 PT Pintu Kemana Saja. All Rights Reserved.
The trading of crypto assets is carried out by PT Pintu Kemana Saja, a licensed and regulated Digital Financial Asset Trader supervised by the Financial Services Authority (OJK), and a member of PT Central Finansial X (CFX) and PT Kliring Komoditi Indonesia (KKI). Crypto asset trading is a high-risk activity. PT Pintu Kemana Saja do not provide any investment and/or crypto asset product recommendations. Users are responsible for thoroughly understanding all aspects related to crypto asset trading (including associated risks) and the use of the application. All decisions related to crypto asset and/or crypto asset futures contract trading are made independently by the user.